

This feature is only available to clients who have contracted with Lucidworks for Agent Studio.
Duration options
The date/time range selector at the top of the screen controls the time period for all data displayed on the page. When you change the duration, the summary metrics, the Total Requests chart, and the Generative AI Models table all update to reflect the selected range. Available presets include today, last 24 hours, last week, last month, last 90 days, last quarter, and last year. You can also select a custom range by specifying a start date and an end date.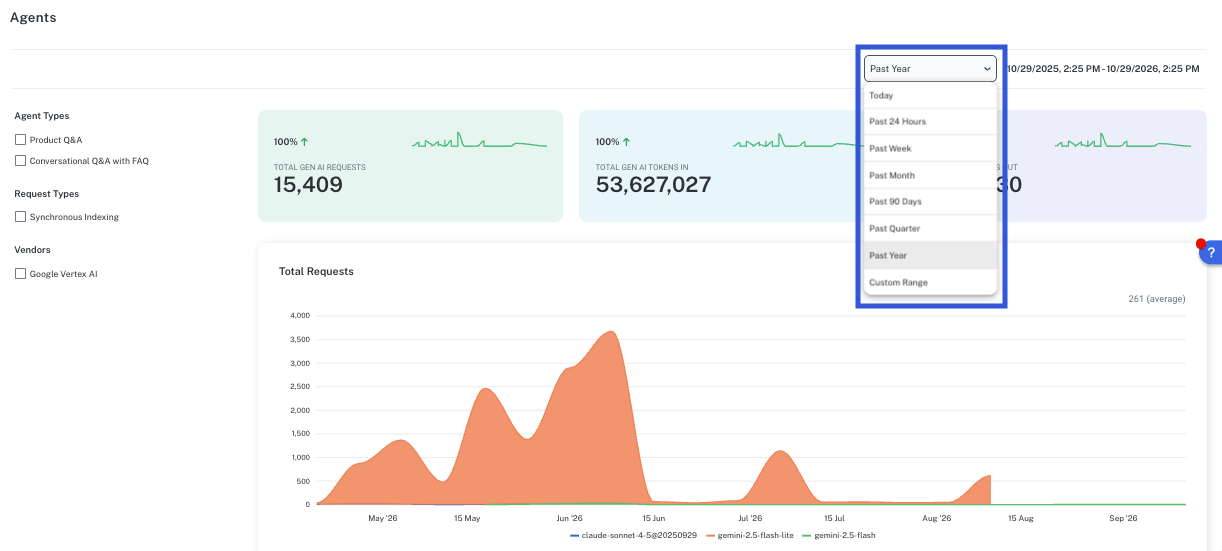
Facets
Facets filter all data displayed on the page. When you select one or more facet values, the summary metrics, the Total Requests chart, and the Generative AI Models table all update to reflect only the matching data. If no facets are selected, data for all values displays.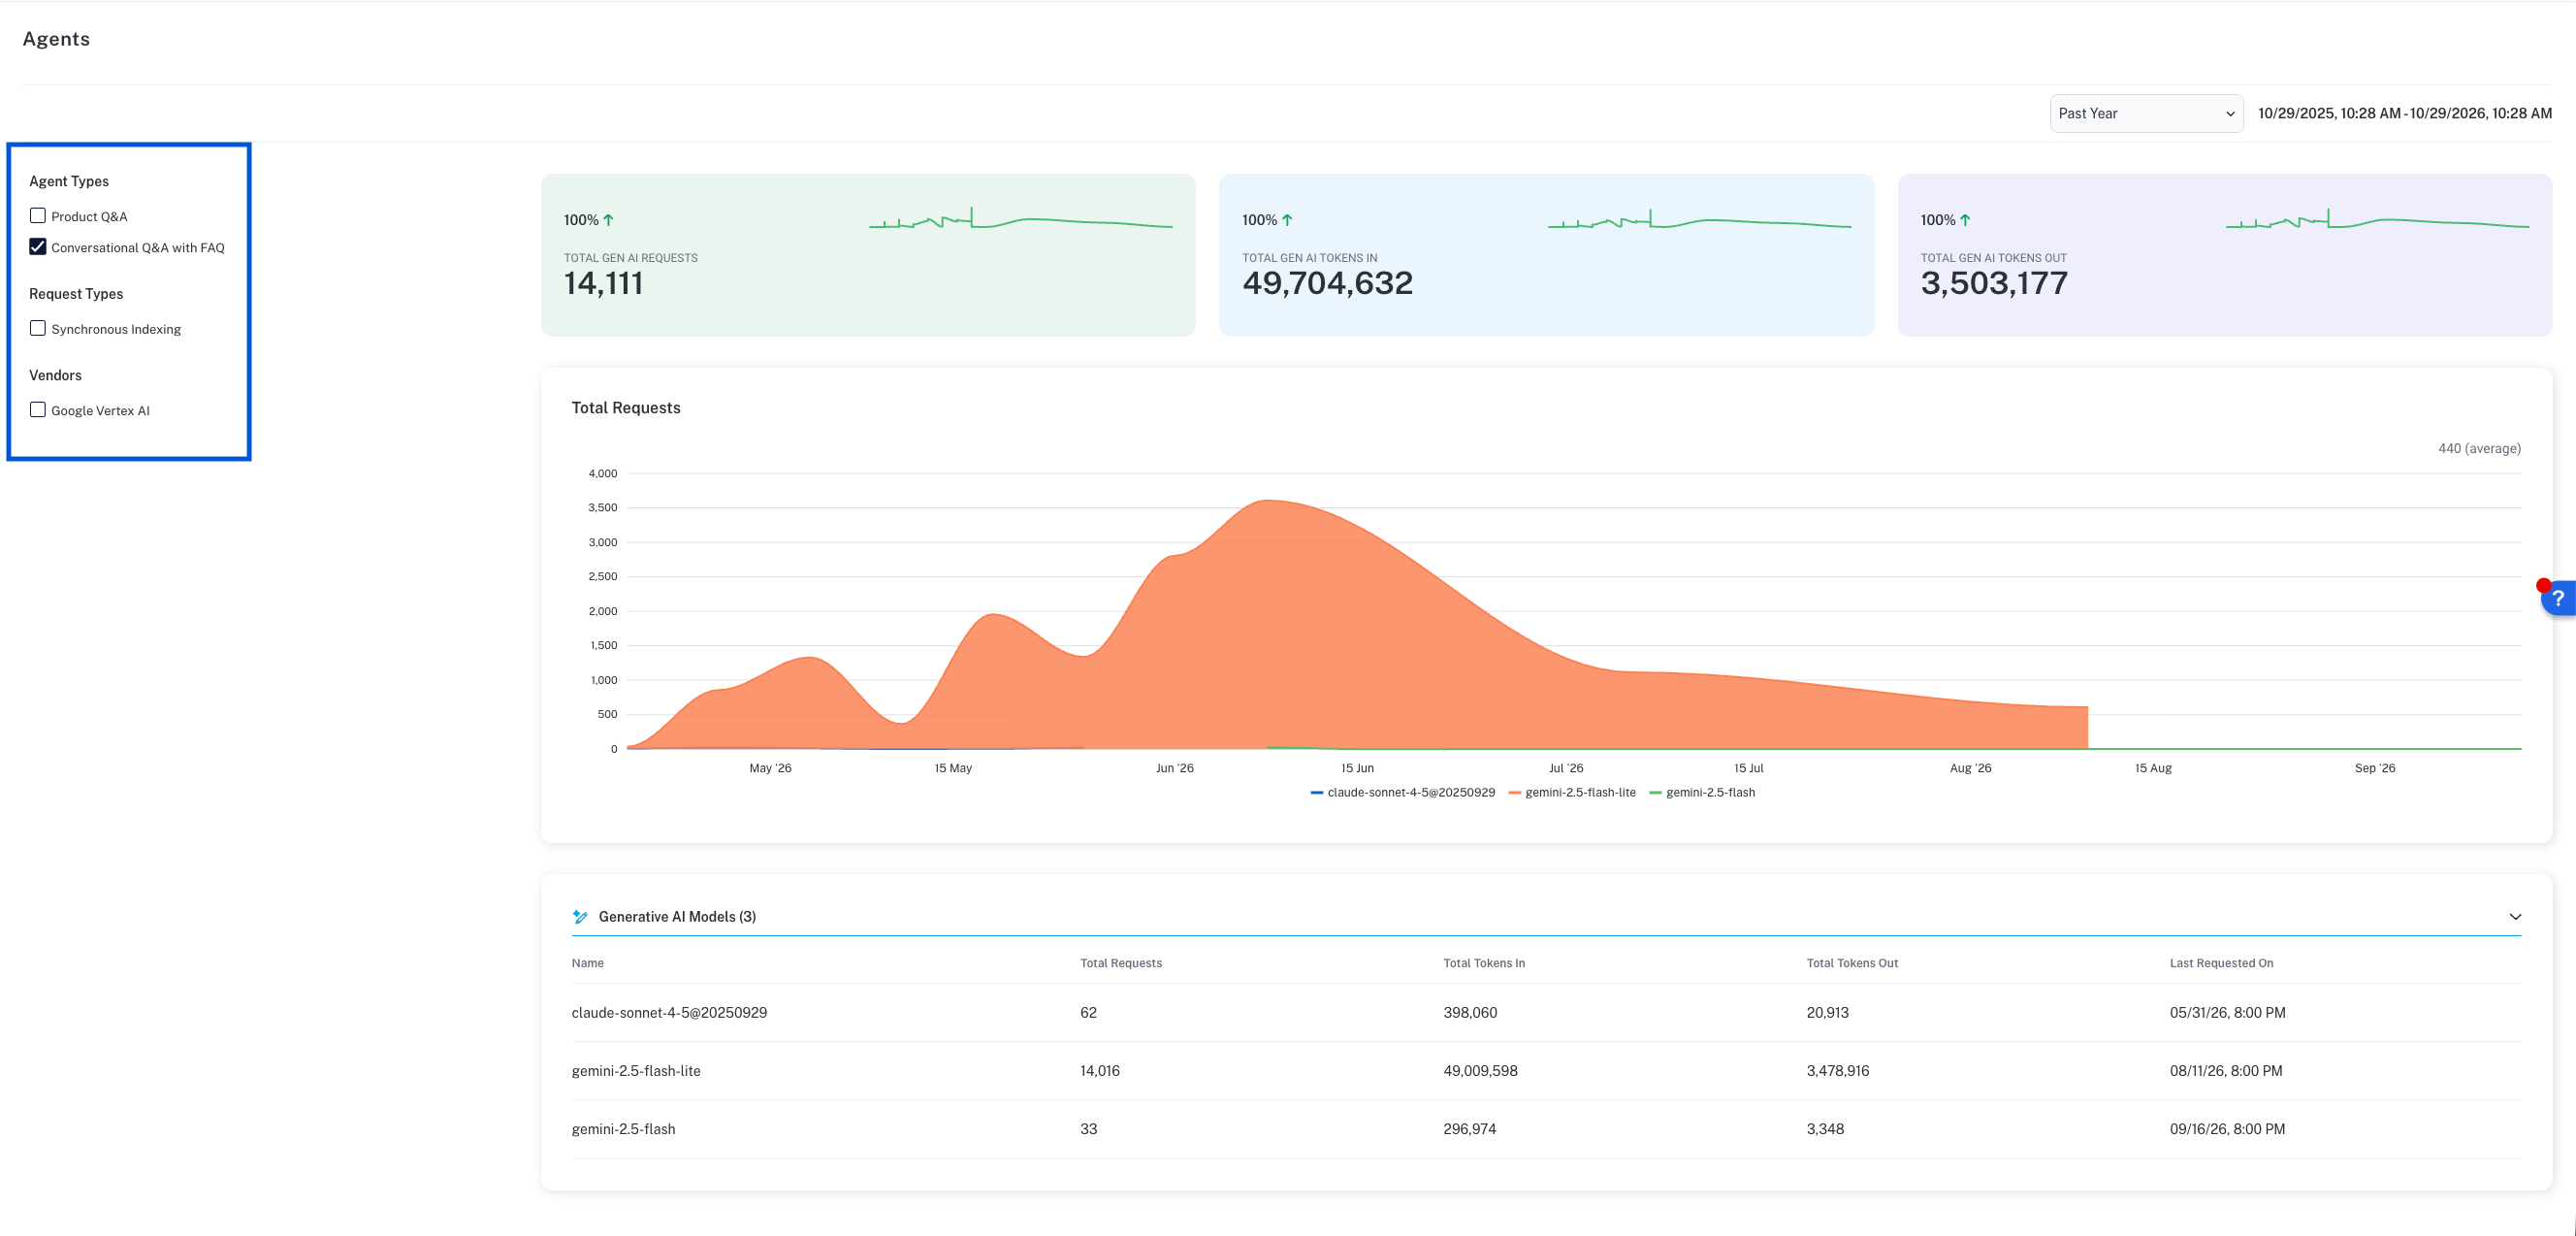
Summary metrics
The summary metrics section displays a set of key performance indicator (KPI) cards, each representing a key measurement for the selected duration and facets. The indicators include total number of generative AI requests, the total number of tokens (individual units of information like words or phrases) submitted in requests, and the total number of tokens returned in responses.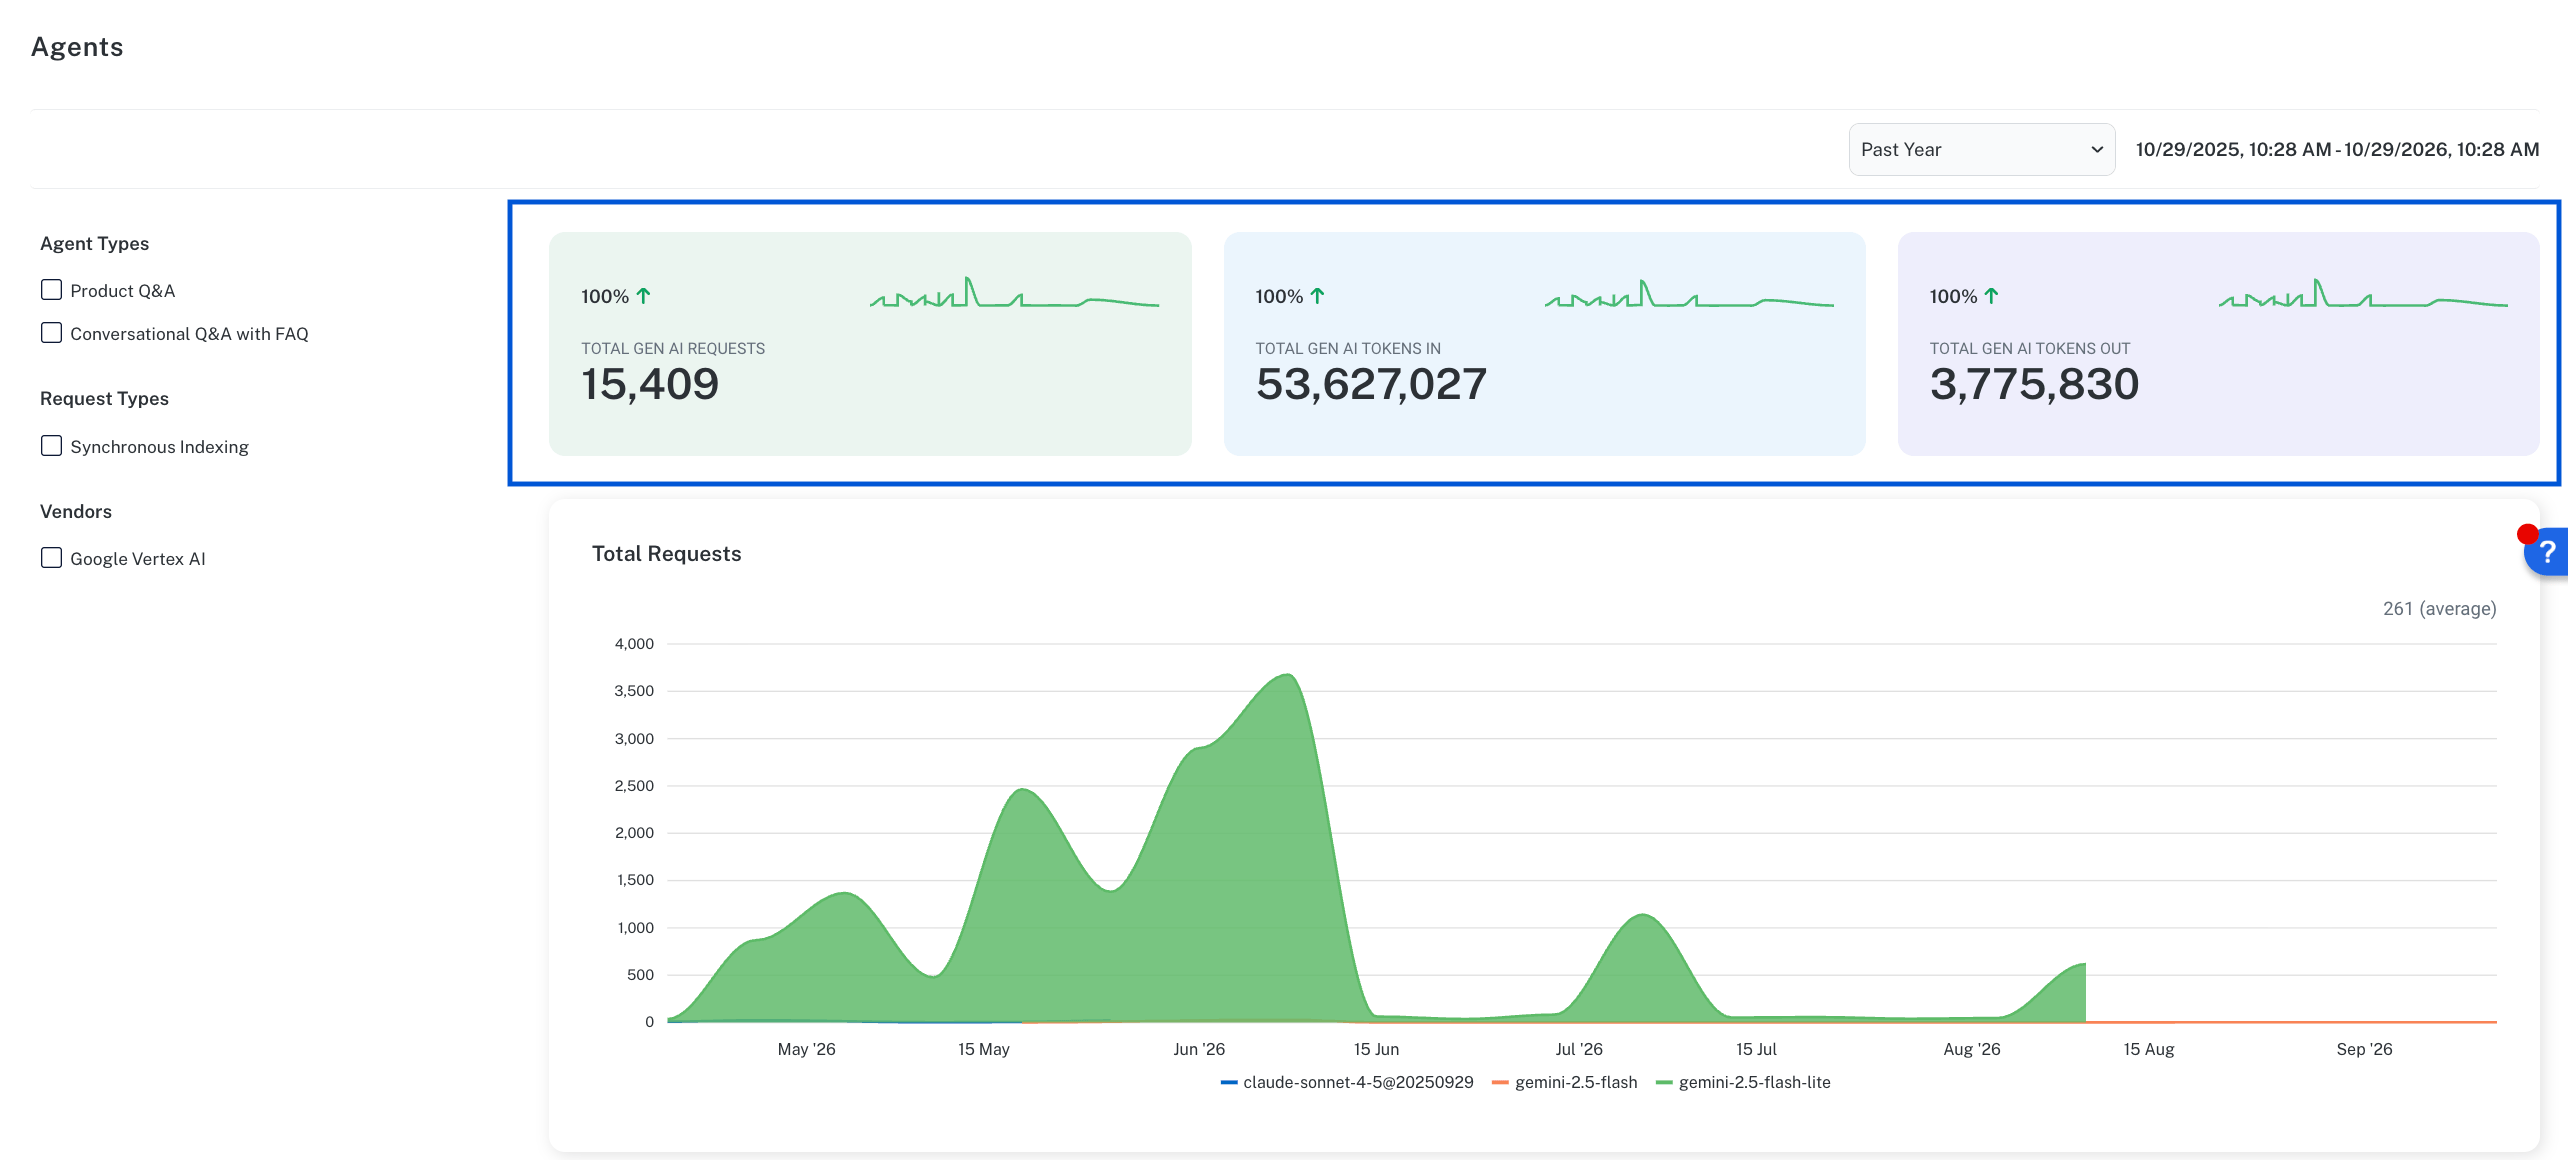
string
The name of the measurement.
Values are Total Gen AI Requests, Total Gen AI Tokens In, and Total Gen AI Tokens Out.
number
The total for the selected time period and facets.
For example, you can select the last 90 days and the Product Q&A agent type facet to view the total number of requests submitted to all Product Q&A agents during the last 90 days.
number
The difference between the current period and the previous period of equal length.
A positive change displays in green and a negative change displays in red.
string
A sparkline (a small line chart without axis information) showing how the metric changed over the selected period.
The color of the trend line reflects whether the change is positive or negative.
Total Requests chart
The Total Requests chart is a graphical representation that shows request volume over the selected time period and facets, with each generative AI model displayed as a separate, color-coded portion of the graph.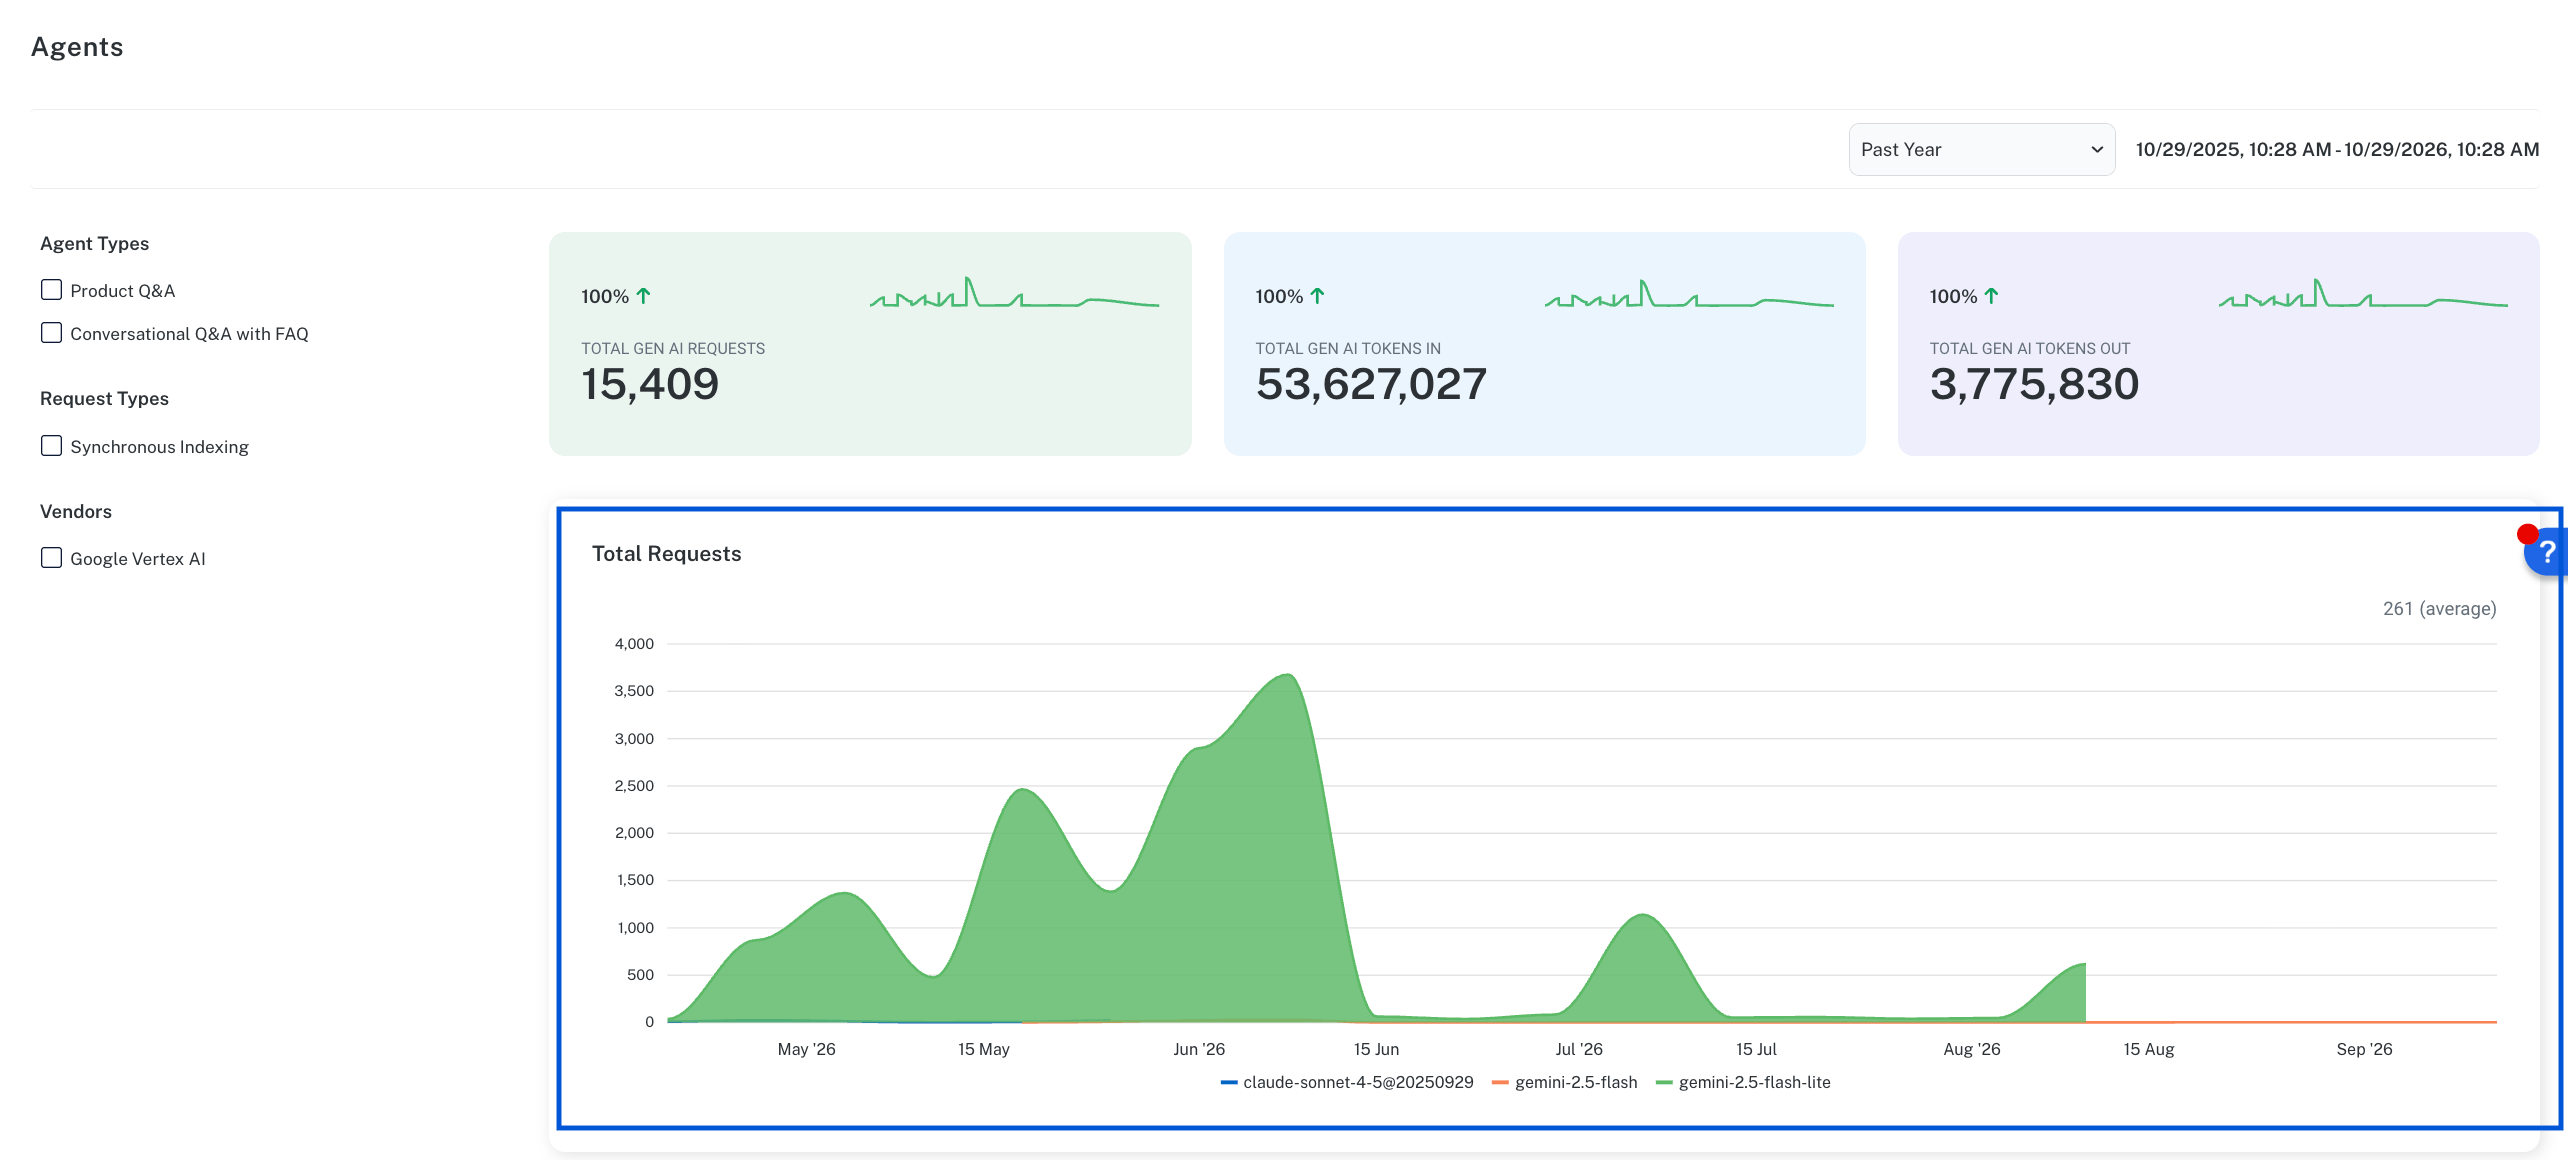
number
The number of requests.
string
Time, formatted to the selected duration.
For example, if you select the past year, the axis displays one interval per month.
number
The average number of requests per interval for the selected period.
The number displays in the top right corner of the chart.
The average is calculated by dividing the total number of requests by the number of intervals in the selected time period and facets.
For example, if you select the last 90 days for the Conversational Q&A FAQ agent type, the average is calculated by dividing the total number of requests to that agent type by 90.
string
Each generative AI model appears as a separate color-coded section on the chart.
The legend below the chart identifies each model by name and color.
Click a model in the legend to show or hide that information.
Generative AI Models table
The Generative AI Models table lists each generative AI model that received requests during the selected time period. The panel title shows the total number of models in the list, and the panel is collapsible.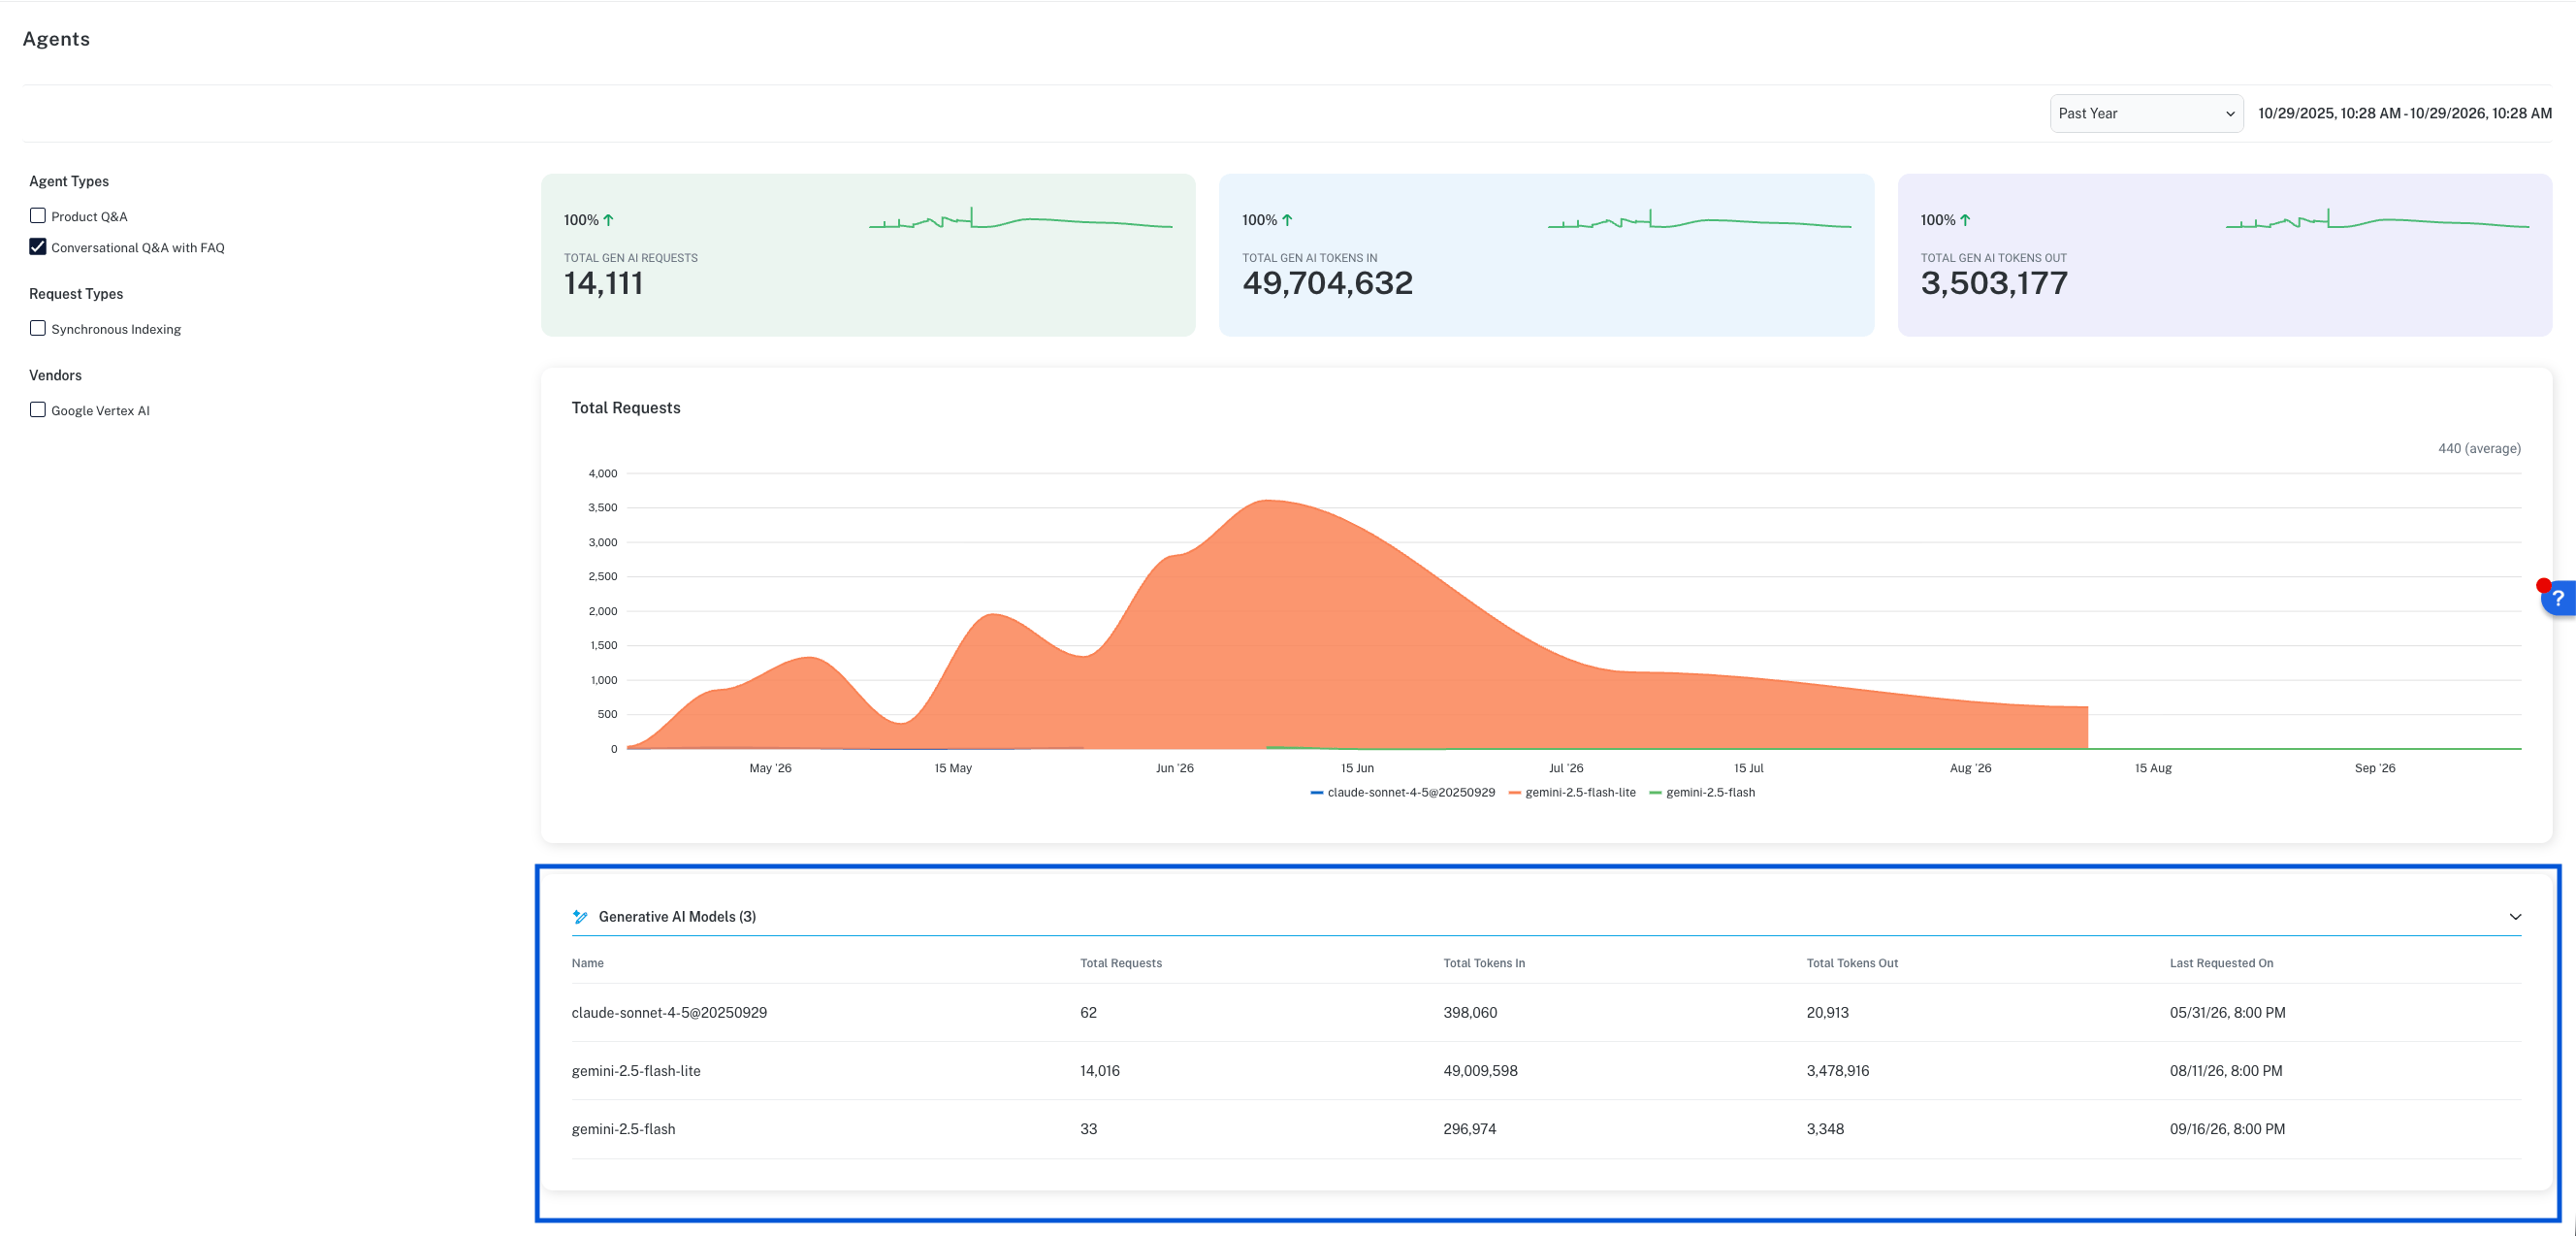
string
The name of the generative AI model used by the agents.
number
The total number of requests submitted to that model for the selected time period and facets.
number
The total number of tokens (individual units of information like words or phrases) submitted in requests to that model for the selected time period and facets.
number
The total number of tokens (individual units of information like words or phrases) returned in responses from that model for the selected time period and facets.
string
The date and time the model last received a request within the selected time period and facets.