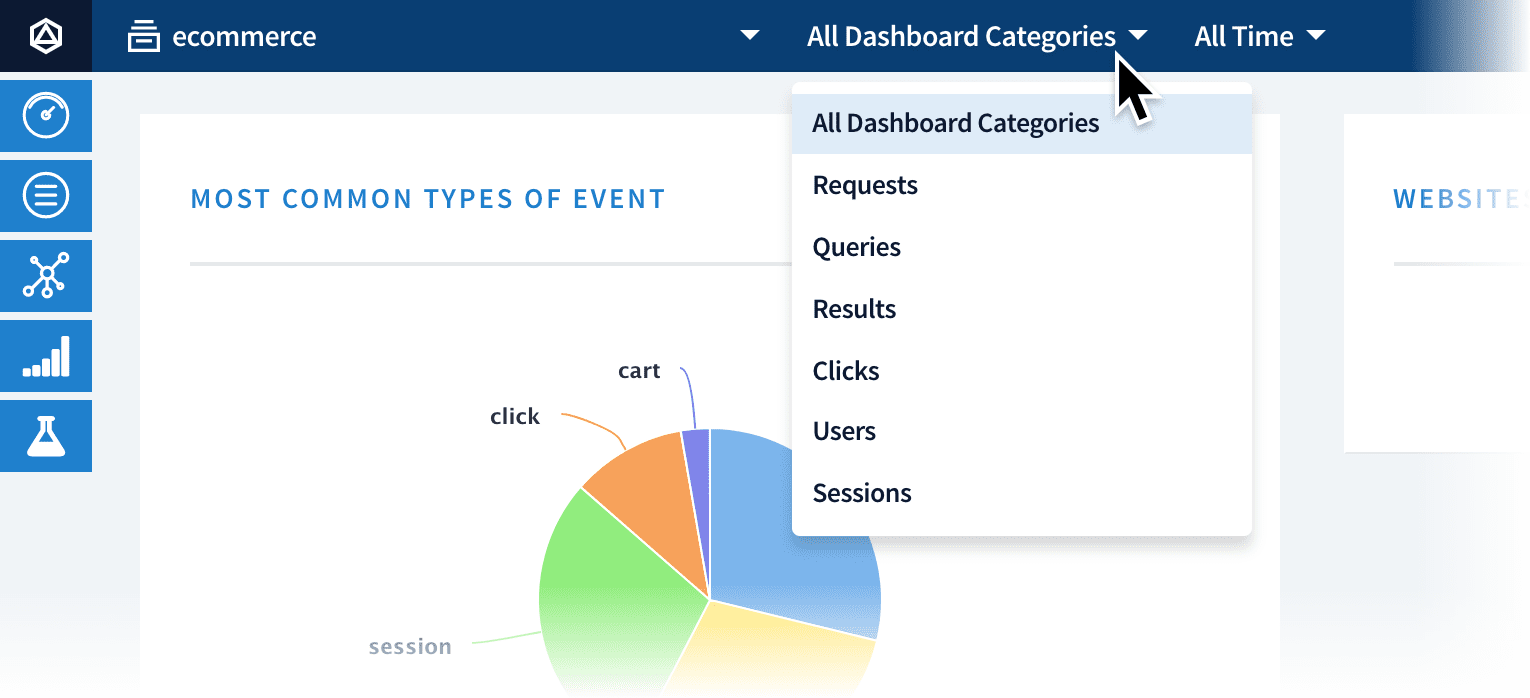
When you open the Dashboards page, it displays graphs and tables for attributes that are common to all signals. For more specific charts, you can open the All Dashboard Categories menu at the top and select a category:
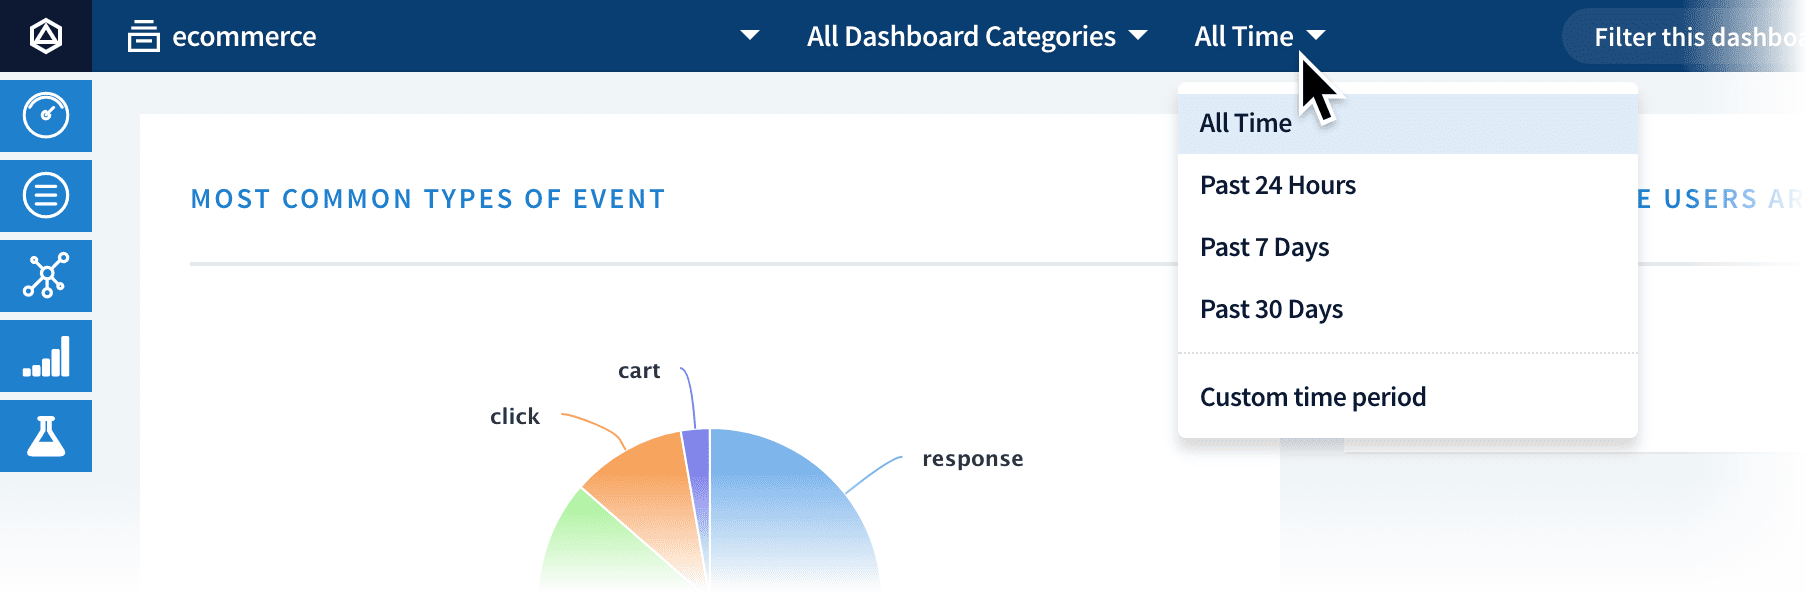
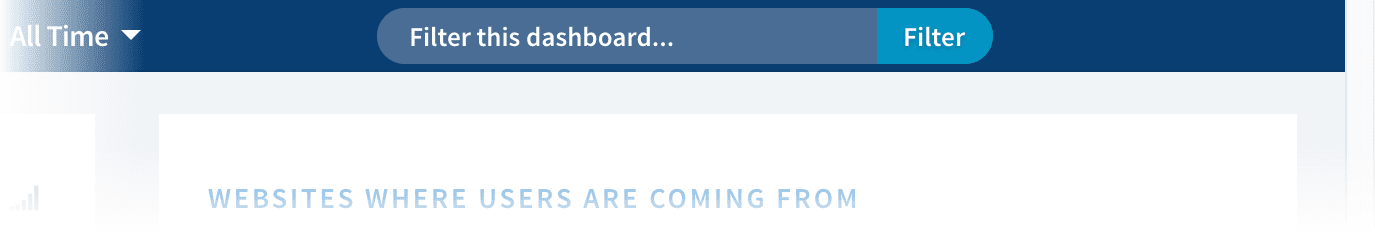
You can filter by timeframe using the All Time menu:To filter by the content of the data, enter a string in the Filter this dashboard… text box:For more information, see dashboards.