List all Fusion component services
The Fusionintrospect endpoint lists basic information about endpoints and parameters for all Fusion endpoints,
including the Connectors services endpoints:
Assign Fusion request IDs
Fusion automatically assigns each API request a Fusion request ID. Optionally, you can assign your own Fusion request IDs. In this example of a search, the request does not set the Fusion request ID. Fusion assigns one, in this case,PdNfxc1V2o:
Movie202:
Use Dashboards in Fusion
Use Dashboards in Fusion
This topic details the options available to use Fusion dashboards.
For more information, see Fusion 4.x Built-in Dashboards.
Dashboards main page
When you open the Fusion dashboards, your organization’s dashboards display, as well as the EXPLORE DASHBOARDS section that provides options to create or display specific types of dashboards.You can click the icons in the top right corner of the screen to perform the following functions:| Option | Notes |
|---|---|
| Open the saved default dashboard. | |
Create a new dashboard. Options are:
| |
Load a dashboard using one of the following options:
| |
Save options include:
| |
| Configure Dashboard | Click to configure tabs for General, Rows, Control, and Solr dashboard settings. |
| Delete a dashboard saved in Solr |
|
| Delete a dashboard saved in a file | Navigate to the file and delete it. |
| Delete a dashboard saved as a GitHub gist | Open the gist URL and click Delete. |
Interact with data
The table describes options to interact with data displayed in certain dashboards.| Option | Notes |
|---|---|
| Collections | Choose the collection from which to obtain data. If a dashboard is configured to let users choose among collections, select the collection from the Collections drop-down list at the top right of the dashboard. |
Enter the value to search.
| |
Click to clear the search box and return the most general query, as if you entered *.*. | |
| Indicates the query is waiting for data to be returned. If the indicator spins for an extended time while other panels display data, the panel is not configured correctly. | |
| Select item | Click a table row. In a graphical-visualization panel, click the data item. NOTE: Not all panel types let you select data in this way. |
| Click to enter the number of rows to export and select the destination file type. For example, CSV, XML, or JSON. | |
| Click to hide the row from the display. | |
| Click the row to display detailed information. |
Interact with specific types of panels
The table describes options for specific types of panels.Table and text panels
| Option | Notes |
|---|---|
| Show or hide the field list | Click the right or left arrow, respectively, at the top of the panel. |
| Sort a table column | Click the up arrow at the top of the column to sort in ascending order. Click the down arrow at the top of the column to sort in descending order. |
| View next or previous page of hits | Click the right or left arrow, respectively, at the bottom of the page of hits. |
| Click to view the first page of hits for that particular panel. | |
| Show record details | Click the table row and then select the display format of Table, JSON, or Raw. |
| Hide details | Click the up arrow at the top right of the details. |
Histogram and Range Facet panels
The table describes options for the Histogram and Range Facet panels.| Option | Notes |
|---|---|
| Zoom in on a subset of data | Click the area you want to enlarge, then drag across the range of data to zoom in. |
| Click to zoom out. |
Filtering panels
The table describes filter options for panels.| Option | Notes |
|---|---|
| Click to edit a panel filter. | |
| Click to toggle the filter to the opposite setting (on or off). | |
| Click to remove the current filter. CAUTION: To display correctly, specific filters must be set for certain types of panels. Fusion also creates filters based on your interactions with data. You can add a filter back, but there is no undo. Before you remove a filter, toggle off the filter and verify the results. If the results are accurate, it is safe to remove it. |
Heat Map panels
The table describes the option for heat map panels.| Option | Notes |
|---|---|
| Click to reverse the display of rows and columns. |
Filter by Fusion request ID
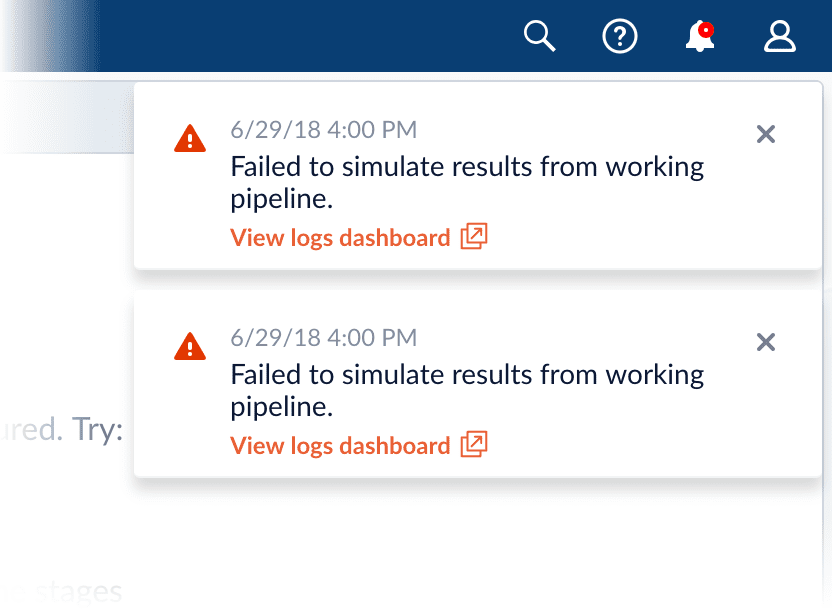
To only display information about log entries with a specific Fusion request ID, you can filter the contents of a logs dashboard by the Fusion request ID.Filter the contents in the following ways:- Click a link in the error message or toast
- Filter in a logs dashboard
- Append a query filter parameter to the dashboard URL
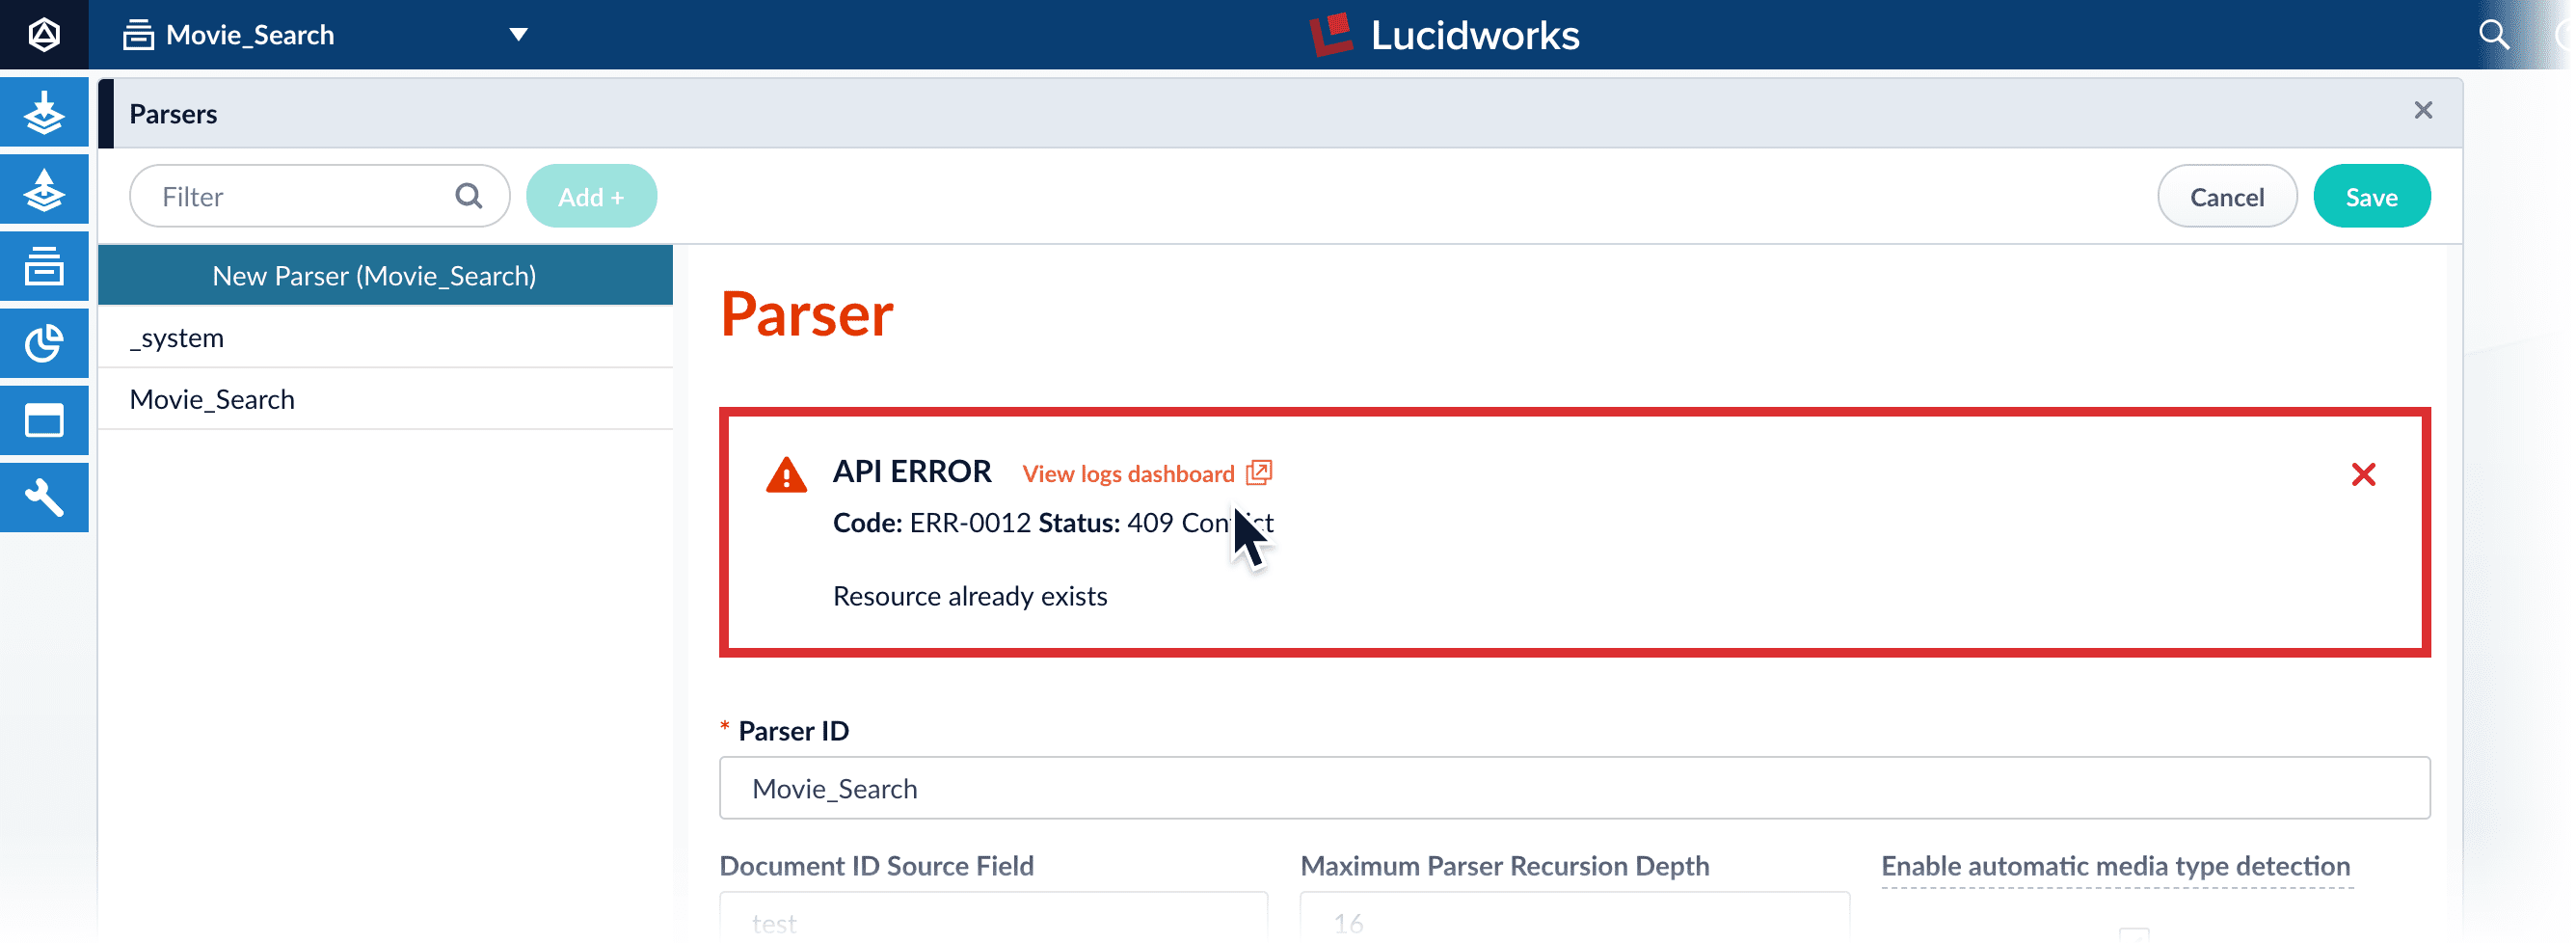
Click a link in the error message or toast
To view the dashboard for a Fusion UI API error or API error toast, click View logs dashboard. The system displays the dashboard using a filter for that request ID.API error with link in Fusion UI:mdc_requestId_s field displays the fusion-request-id of BWQSjPPYgB.Filter in a logs dashboard
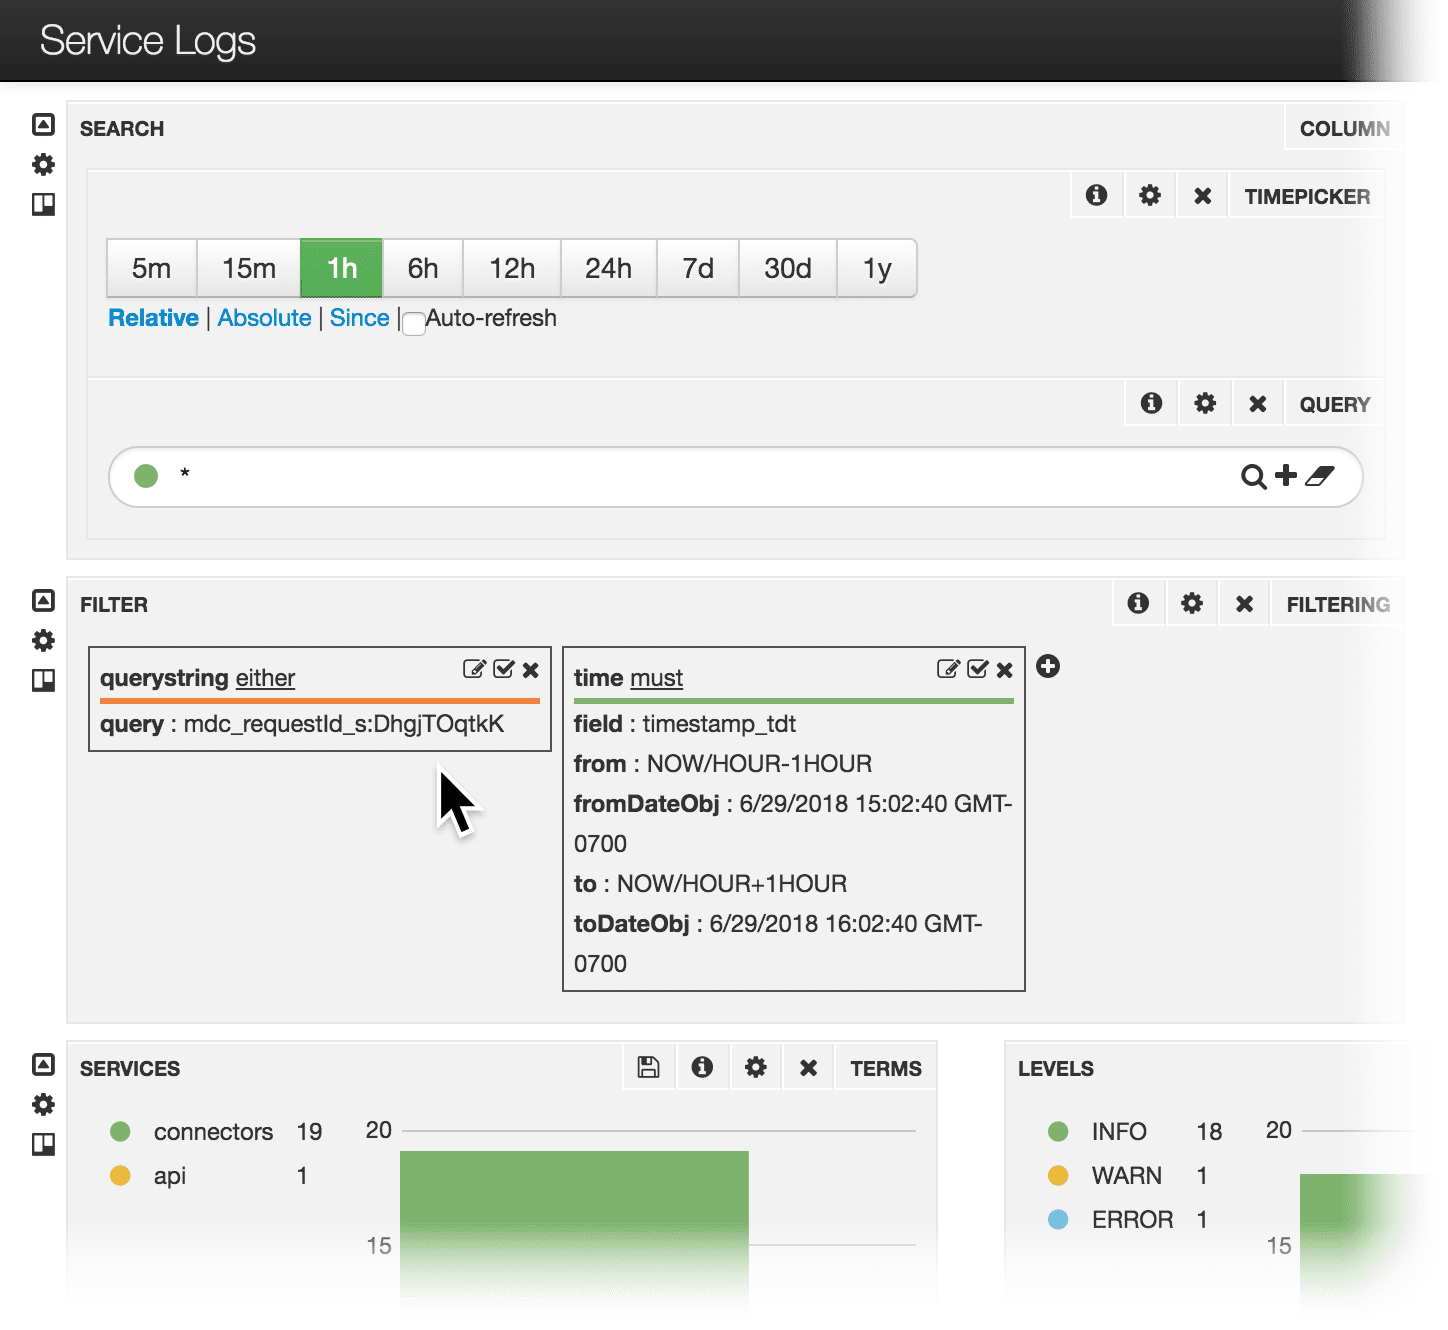
This section only applies to Fusion versions prior to 5.4.0.
-
Obtain the Fusion request ID returned by a request. For example, notice the Fusion request ID
BWQSjPPYgBreturned by this API command: - Open the logs dashboard.
-
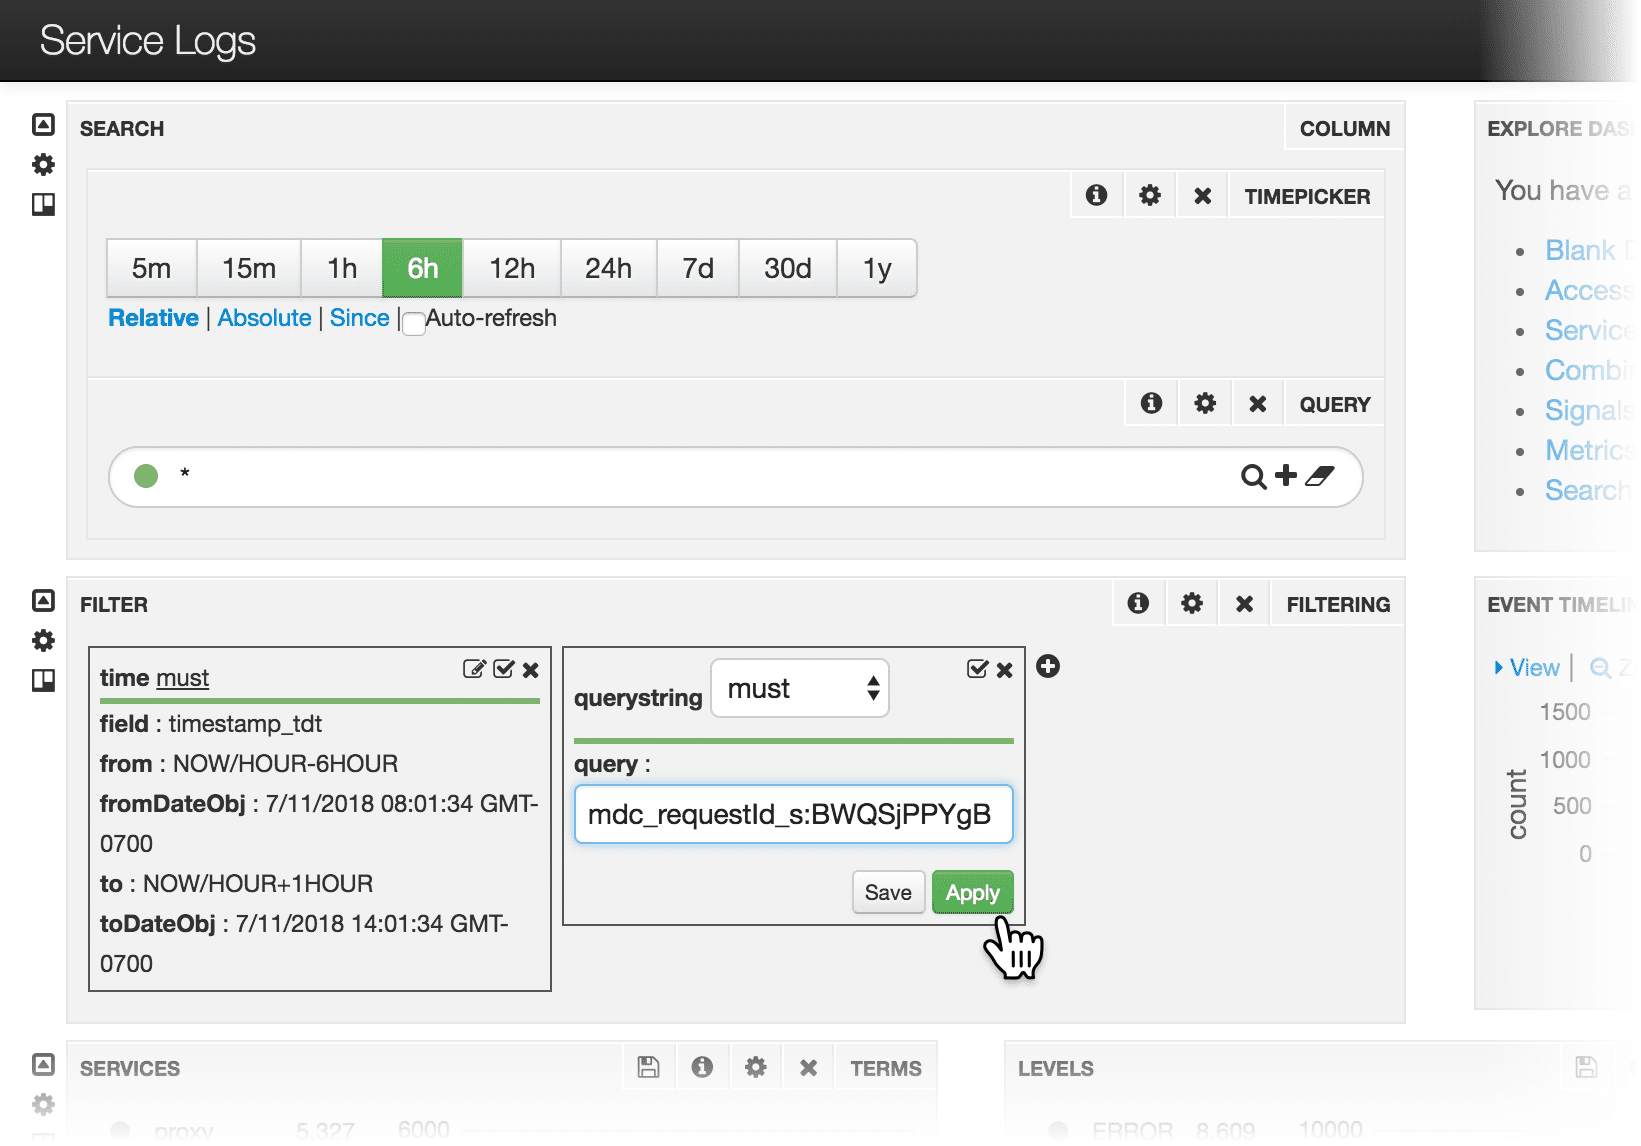
Specify the Fusion request ID in the Filter panel, with a query for the
mdc_requestId_sfield that specifies the value offusion-request-idfor which you want to search.
fusion-request-id is BWQSjPPYgB:Append a query filter parameter to the dashboard URL
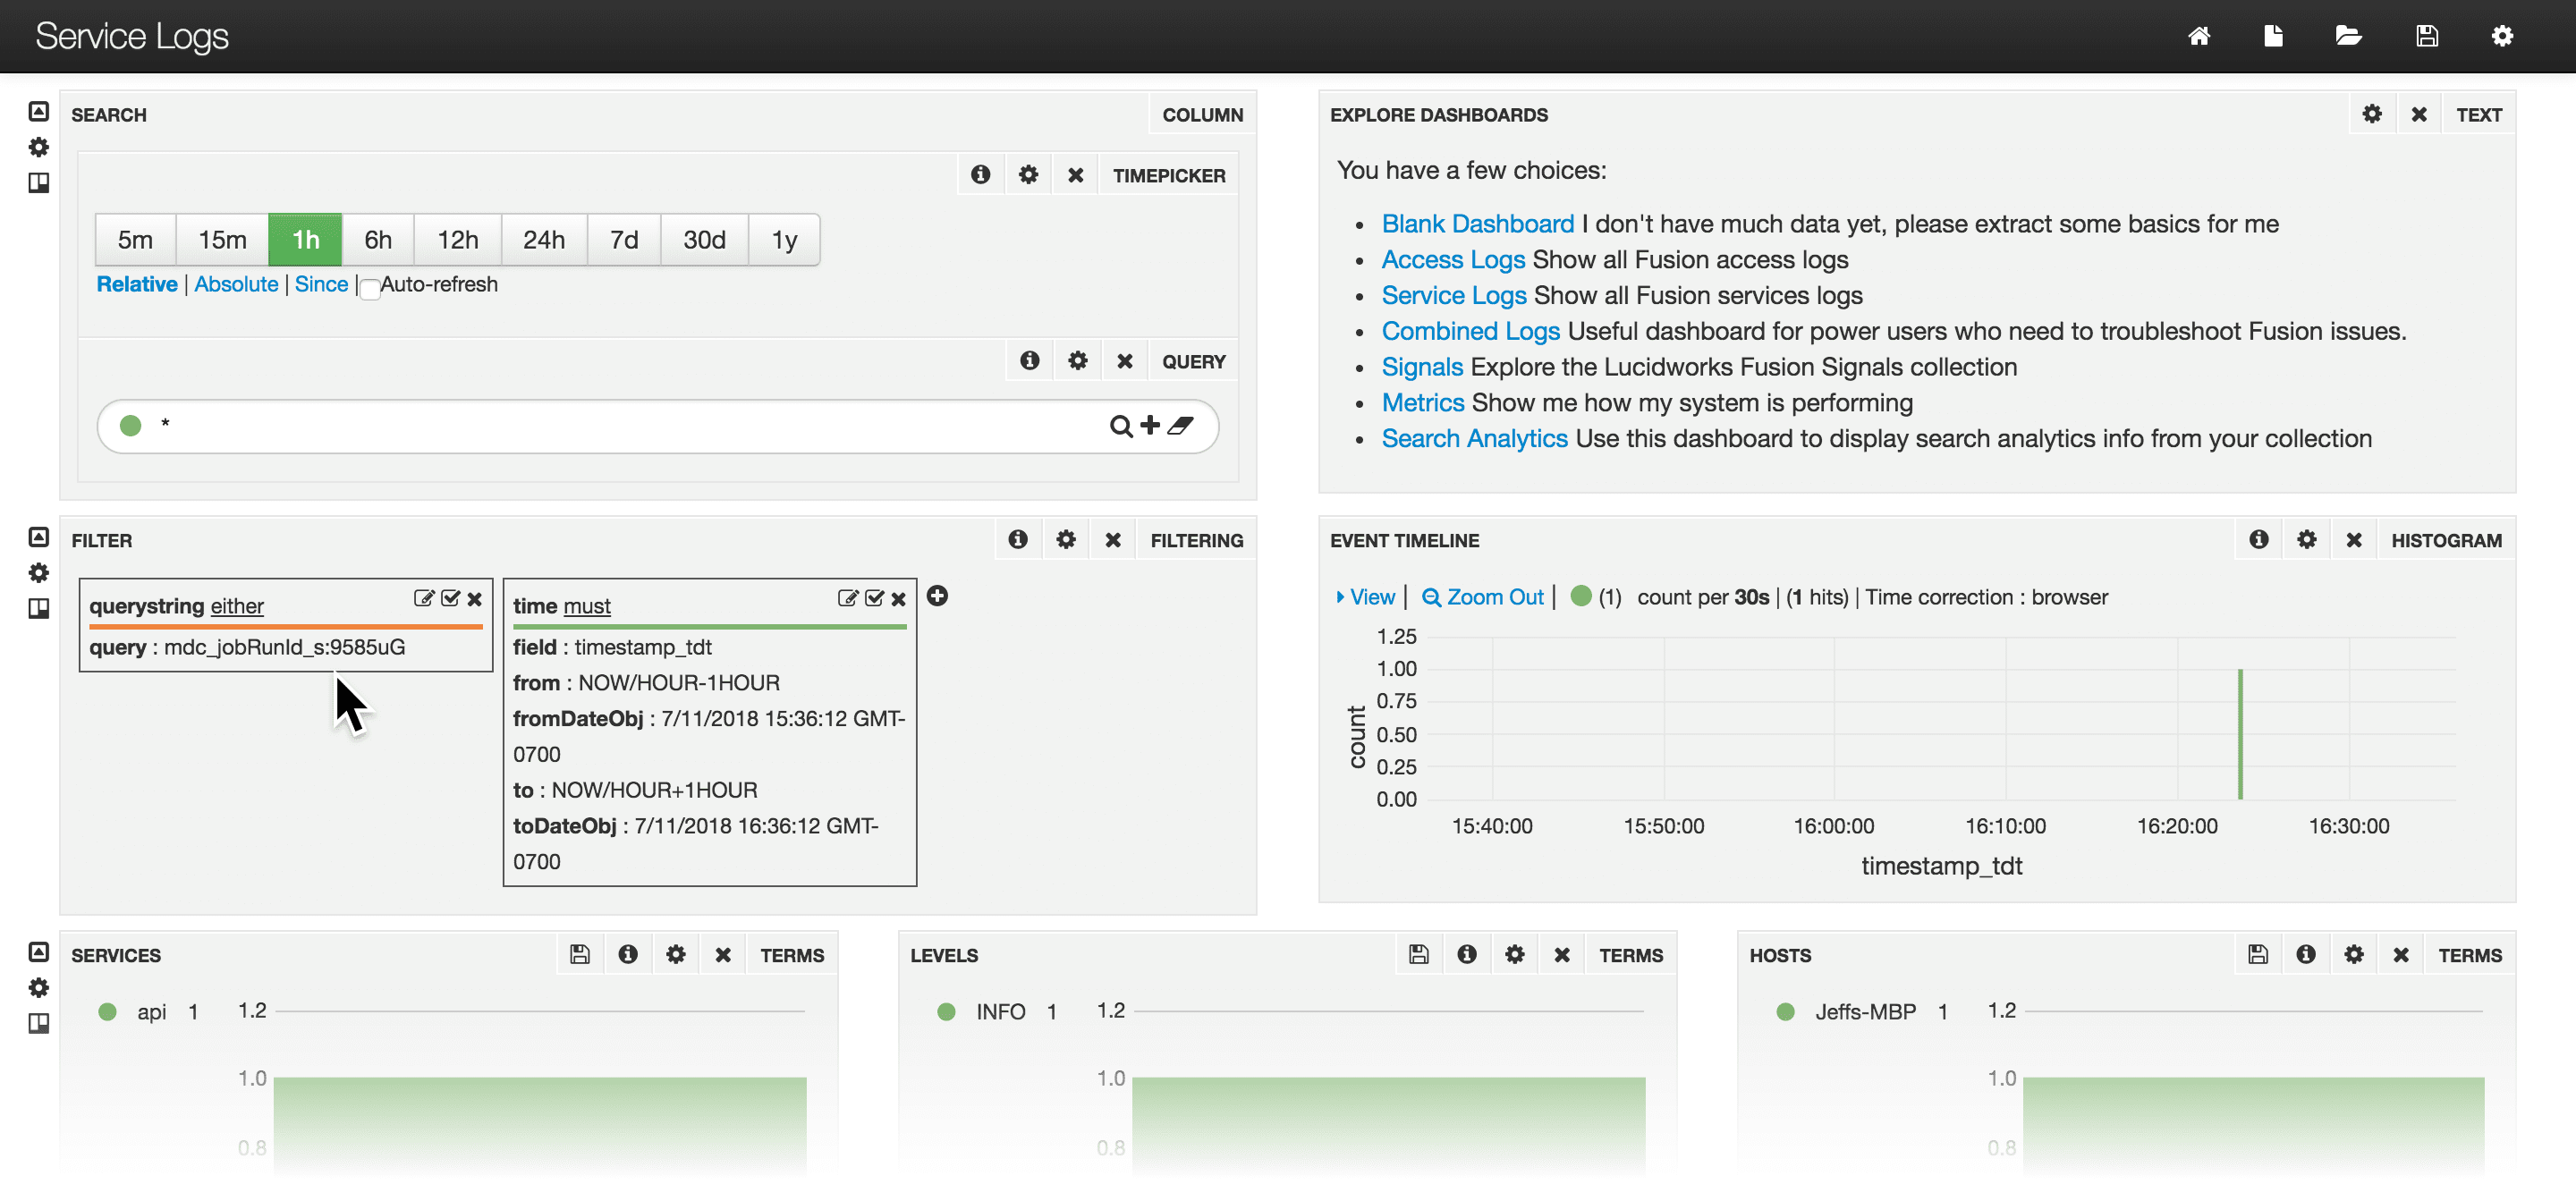
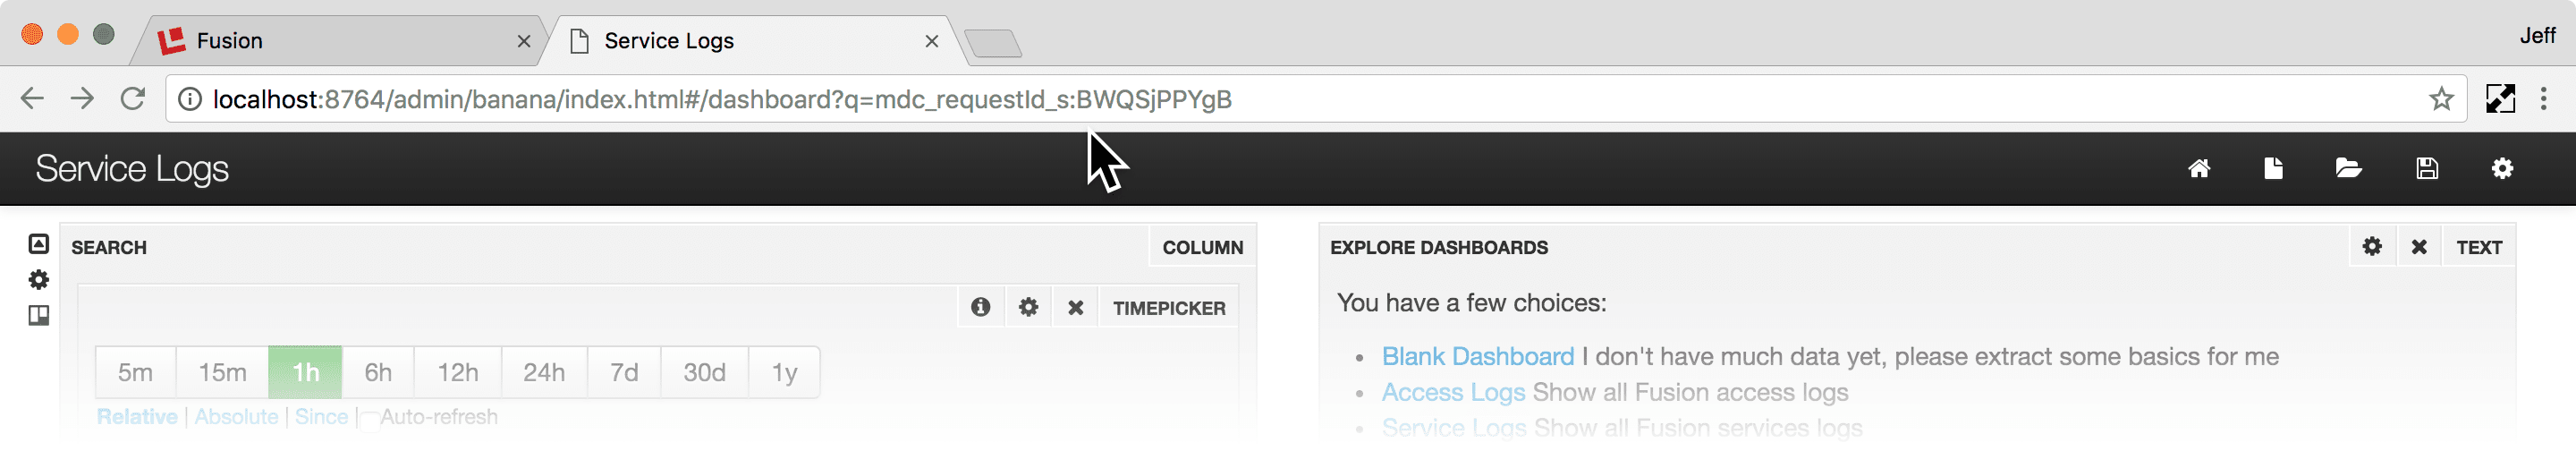
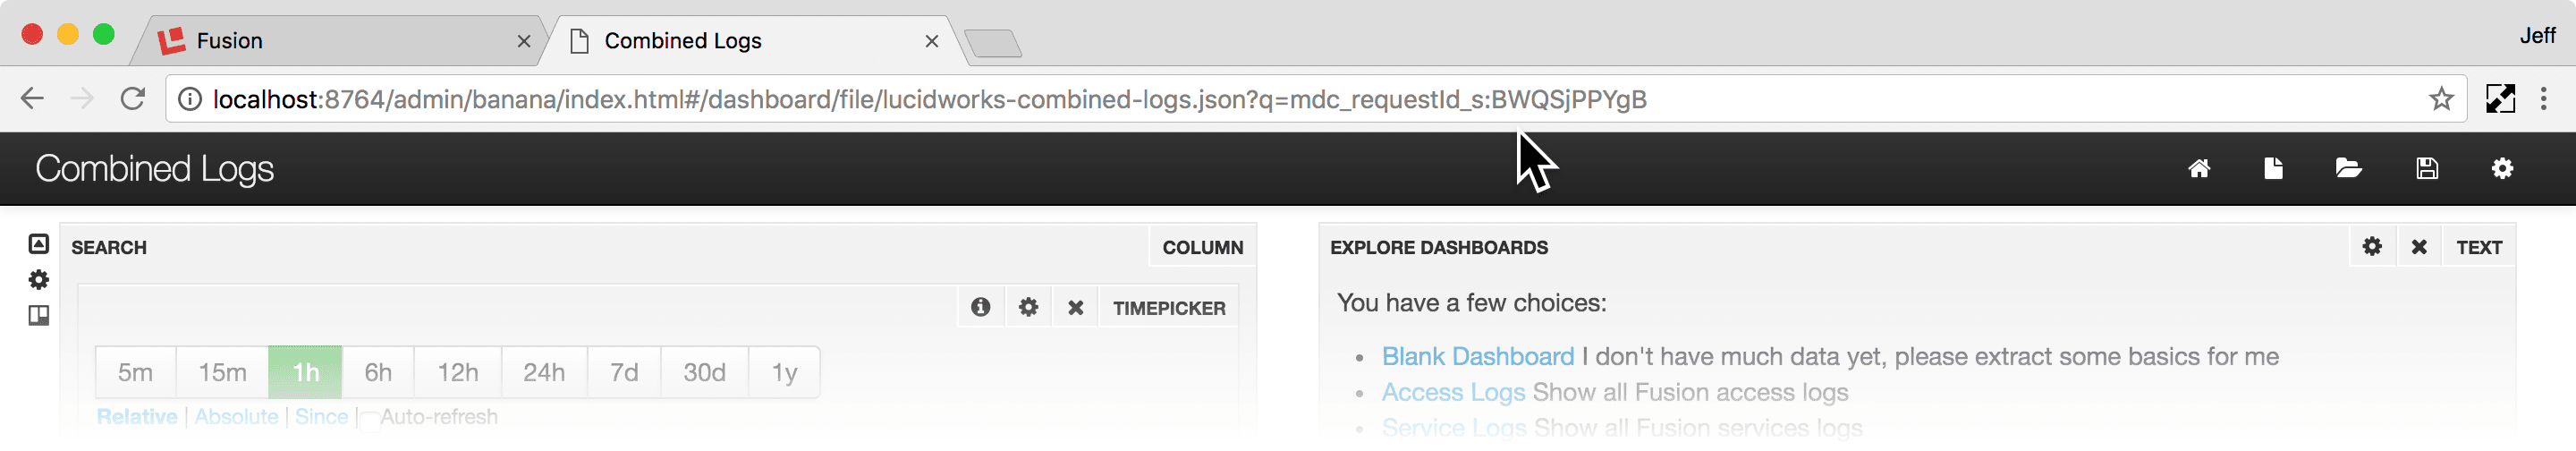
As an alternative to constructing a query filter in the dashboard, you can append a query filter parameter to the dashboard URL. In the query filter, use the field namemdc_requestID_s.Example 1: Default dashboard (Service Logs)Open the Service Logs dashboard from a job history
-
Open the job history.
- For most jobs, click Collections > Jobs, select a job, and then click Job History.
-
For datasource jobs, click Indexing > Datasources, select a datasource, and then click Job History.
In the job history, you will see a link named
runId: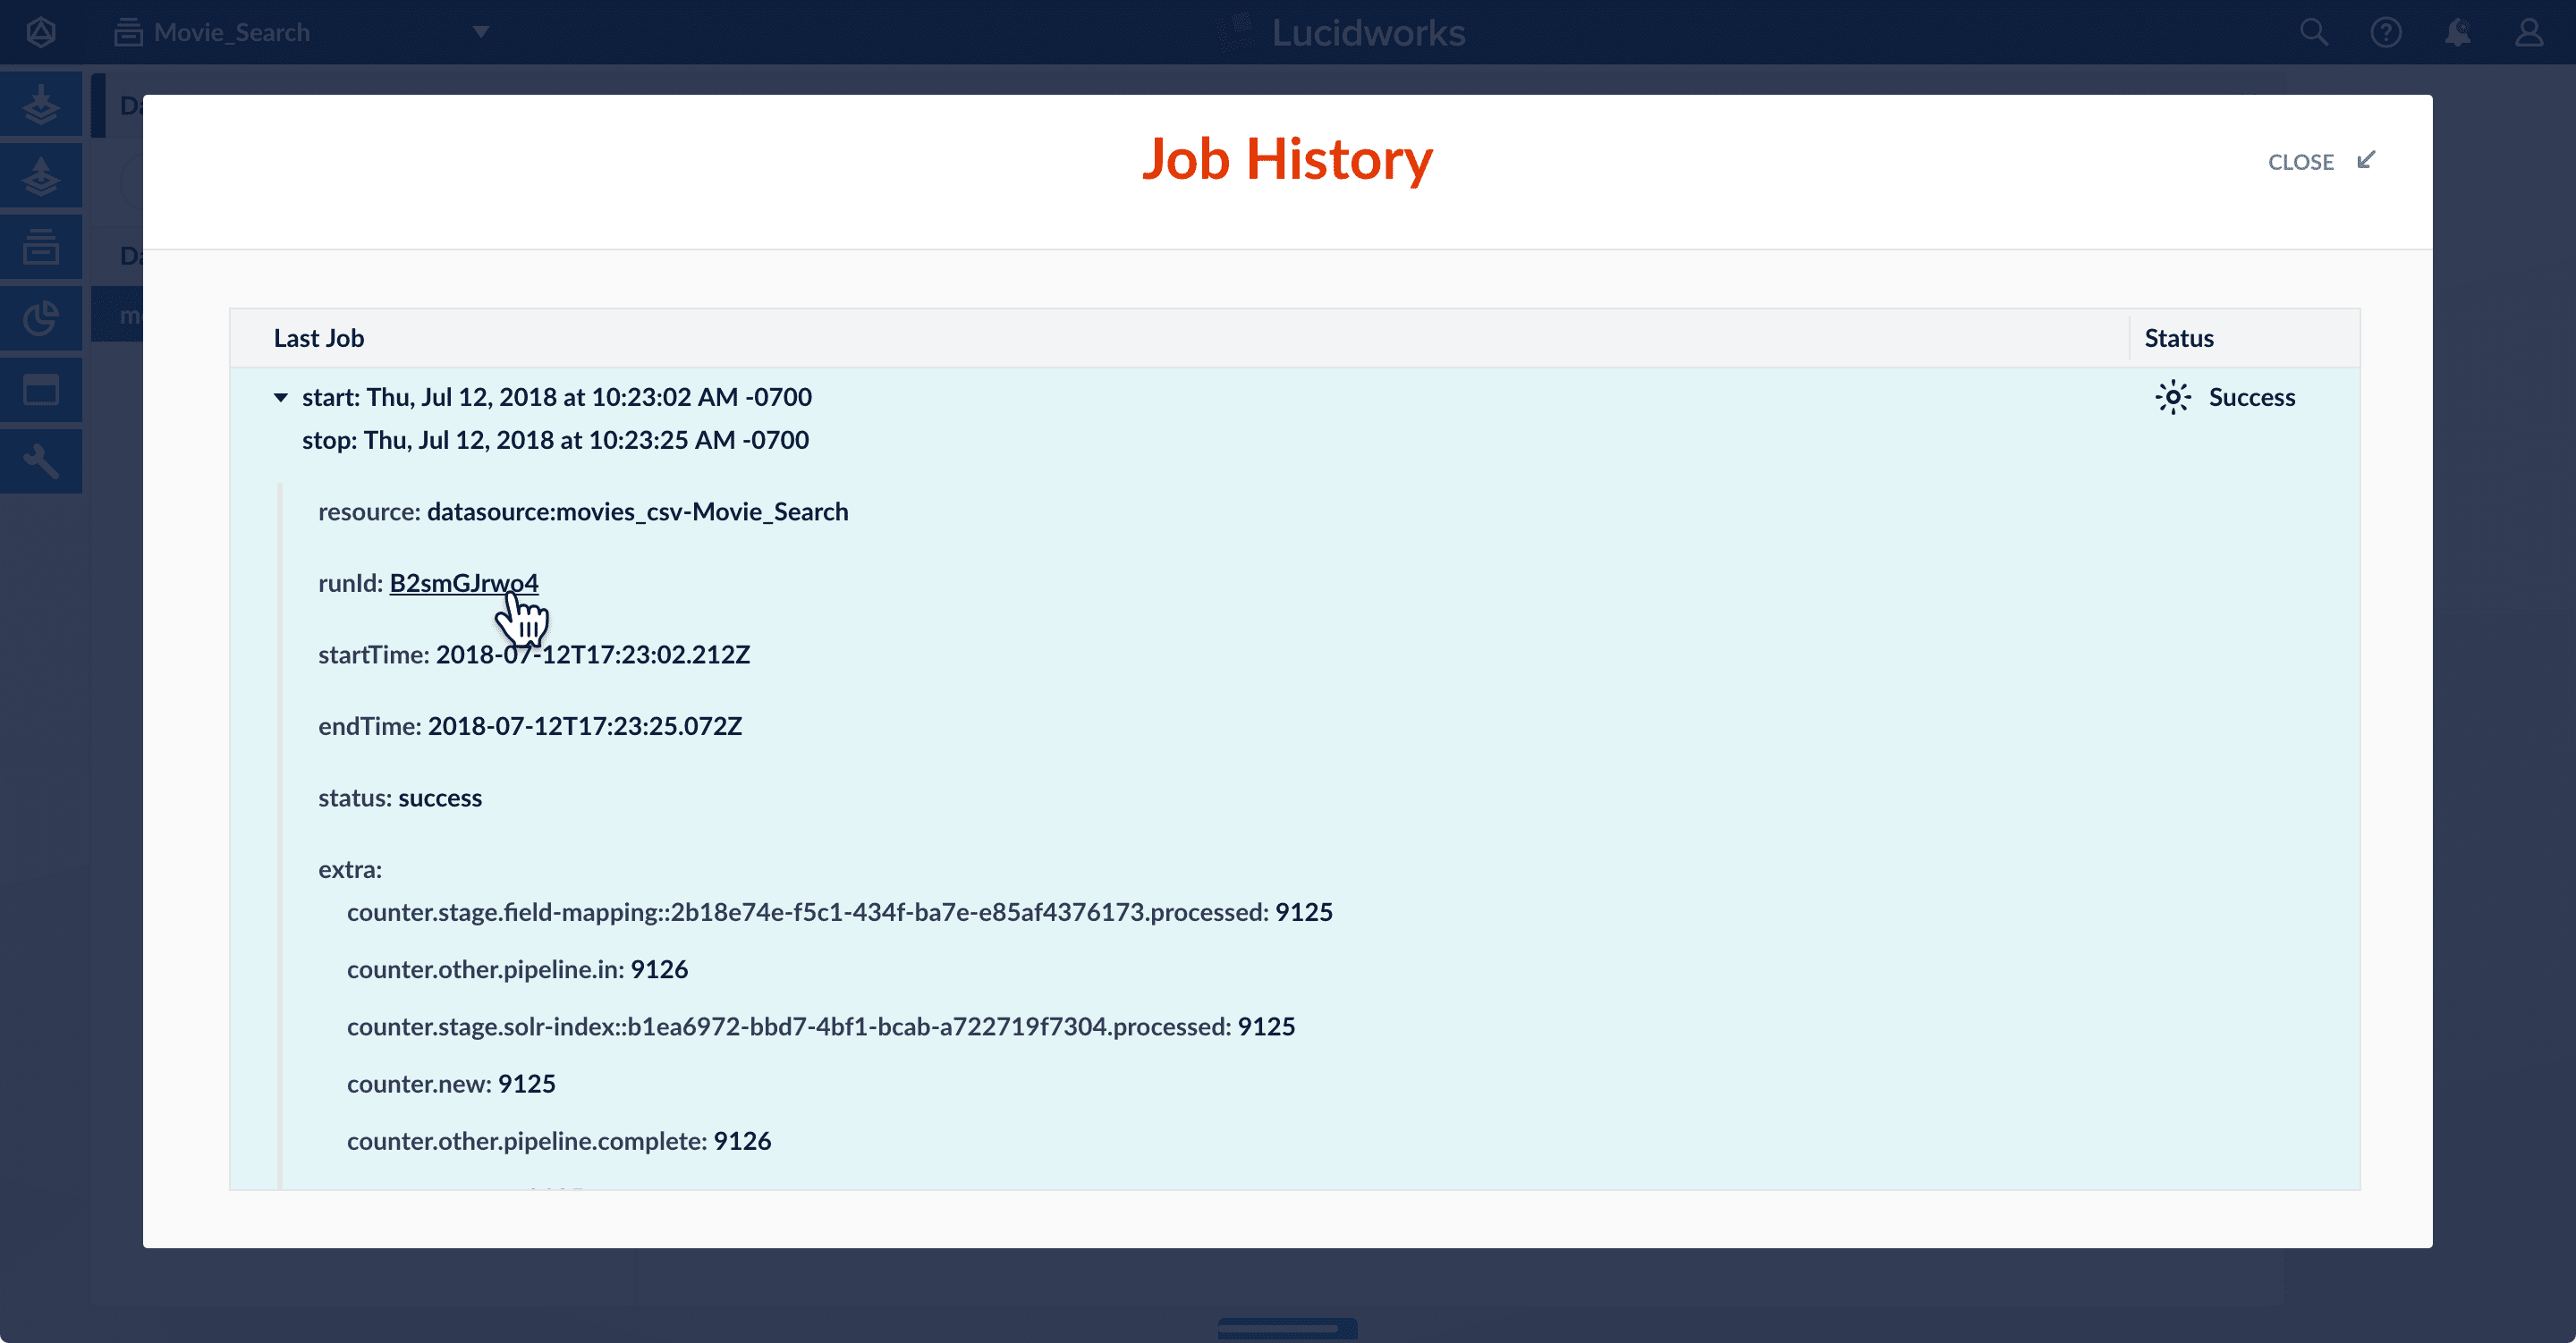
-
Click the link to view the Service Logs dashboard filtered by the
runId: