> ## Documentation Index
> Fetch the complete documentation index at: https://doc.lucidworks.com/llms.txt
> Use this file to discover all available pages before exploring further.
# Head/Tail Analysis Jobs
export const schema = {
"type": "object",
"title": "Head/Tail Analysis",
"description": "Analyzes the head and tail distribution of queries in your signals collection to identify common misspellings and query rewrite opportunities. The job compares high-frequency (head) and low-frequency (tail) queries and optionally generates a tail rewrite table. Review results in the Insights analytics pane.",
"required": ["id", "trainingCollection", "fieldToVectorize", "dataFormat", "countField", "mainType", "signalTypeField", "type"],
"properties": {
"id": {
"type": "string",
"title": "Spark Job ID",
"description": "Sets the unique identifier for this Spark job, used to reference it in the API. Allowed characters: a-z, A-Z, dash (`-`), and underscore (`_`). Must start with a letter.",
"maxLength": 63,
"pattern": "[a-zA-Z][_\\-a-zA-Z0-9]*[a-zA-Z0-9]?"
},
"sparkConfig": {
"type": "array",
"title": "Spark Settings",
"description": "Sets Spark configuration key-value pairs applied to this job's execution context. Use entries like `spark.executor.memory=4g` to tune resource allocation beyond cluster defaults.",
"hints": ["advanced"],
"items": {
"type": "object",
"required": ["key"],
"properties": {
"key": {
"type": "string",
"title": "Parameter Name"
},
"value": {
"type": "string",
"title": "Parameter Value"
}
}
}
},
"trainingCollection": {
"type": "string",
"title": "Input Collection",
"description": "Specifies the signals collection containing queries and event counts. Raw signals or aggregation collections are both supported. Update `trainingDataFilterQuery` in Advanced settings when using an aggregation collection.",
"minLength": 1
},
"fieldToVectorize": {
"type": "string",
"title": "Query Field Name",
"description": "Specifies the field in the signals collection that contains query strings. Maps the `query` field by default. Adjust to match the actual query field name in your collection.",
"default": "query",
"minLength": 1
},
"dataFormat": {
"type": "string",
"title": "Data format",
"description": "Specifies the Spark-compatible format of the input signals data, such as `solr`, `parquet`, or `orc`. This controls which Spark connector loads the signals DataFrame.",
"default": "solr",
"minLength": 1
},
"trainingDataFrameConfigOptions": {
"type": "object",
"title": "Dataframe Config Options",
"description": "Sets additional Spark DataFrame loading options as key-value pairs for the input data source. Use connector-specific options such as `zkHost` when reading from non-default Solr configurations.",
"properties": {},
"additionalProperties": {
"type": "string"
},
"hints": ["advanced"]
},
"trainingDataFilterQuery": {
"type": "string",
"title": "Signals data filter query",
"description": "Filters input signals data using a Solr query (for example, `type:click OR type:response`) or a Spark SQL expression for non-Solr sources. Use this to restrict analysis to specific signal types.",
"default": "*:*",
"hints": ["advanced"]
},
"sparkSQL": {
"type": "string",
"title": "Spark SQL filter query",
"description": "Filters input signals data using a Spark SQL expression before processing. The input data is registered as `spark_input`, allowing standard SQL `WHERE` clauses.",
"default": "SELECT * from spark_input",
"hints": ["code/sql", "advanced"]
},
"trainingDataSamplingFraction": {
"type": "number",
"title": "Training data sampling fraction",
"description": "Sets the fraction of input signals data sampled before analysis. Values less than `1.0` speed up processing on very large signals collections at the cost of statistical precision.",
"default": 1,
"hints": ["advanced"],
"maximum": 1,
"exclusiveMaximum": false
},
"randomSeed": {
"type": "integer",
"title": "Random seed",
"description": "Sets the random seed used during data sampling to produce deterministic results. Fix this value to reproduce identical analysis outputs across multiple runs.",
"default": 1234,
"hints": ["advanced"]
},
"outputCollection": {
"type": "string",
"title": "Output Collection",
"description": "Specifies the Solr collection where head/tail analysis results are written. Defaults to the job reports collection if not set. Results are viewable in the Insights analytics pane."
},
"overwriteOutput": {
"type": "boolean",
"title": "Overwrite Output",
"description": "Controls whether the output collection is overwritten when the job runs. This hidden advanced field defaults to `true`. Set to `false` to preserve existing output documents.",
"default": true,
"hints": ["hidden", "advanced"]
},
"dataOutputFormat": {
"type": "string",
"title": "Data output format",
"description": "Specifies the Spark-compatible format for writing analysis output, such as `solr` or `parquet`. Must match the target storage system used for the output collection.",
"default": "solr",
"hints": ["advanced"],
"minLength": 1
},
"sourceFields": {
"type": "string",
"title": "Fields to Load",
"description": "Specifies the field names to load from the input source, limiting which columns are read into the DataFrame. This hidden field is left unset to load all available fields.",
"hints": ["hidden"]
},
"partitionCols": {
"type": "string",
"title": "Partition fields",
"description": "Specifies a comma-delimited list of column names used to partition the output DataFrame before writing to non-Solr storage. Partition columns improve downstream query performance by enabling file pruning.",
"hints": ["advanced"]
},
"writeOptions": {
"type": "array",
"title": "Write Options",
"description": "Sets additional key-value options passed to the Spark writer when writing output to Solr or other sinks. Use entries like `commitWithin=10000` to control Solr commit behavior.",
"hints": ["advanced"],
"items": {
"type": "object",
"required": ["key"],
"properties": {
"key": {
"type": "string",
"title": "Parameter Name"
},
"value": {
"type": "string",
"title": "Parameter Value"
}
}
}
},
"readOptions": {
"type": "array",
"title": "Read Options",
"description": "Sets additional key-value options passed to the Spark reader when loading input from Solr or other sources. Use these to configure connector-specific behavior such as `rows` or `zkHost`.",
"hints": ["advanced"],
"items": {
"type": "object",
"required": ["key"],
"properties": {
"key": {
"type": "string",
"title": "Parameter Name"
},
"value": {
"type": "string",
"title": "Parameter Value"
}
}
}
},
"tailRewriteCollection": {
"type": "string",
"title": "Tail Rewrite Collection",
"description": "Specifies the collection where generated tail rewrite rules are stored. This collection is populated when `tailRewrite` is `true` and can be used to feed query rewrite rules back into the search pipeline.",
"minLength": 1
},
"analyzerConfigQuery": {
"type": "string",
"title": "Lucene Analyzer Schema",
"description": "Sets the Lucene text analyzer configuration applied to query strings during feature extraction. The default uses standard tokenization with lowercasing and English minimal stemming.",
"default": "{ \"analyzers\": [ { \"name\": \"StdTokLowerStem\",\"charFilters\": [ { \"type\": \"htmlstrip\" } ],\"tokenizer\": { \"type\": \"standard\" },\"filters\": [{ \"type\": \"lowercase\" },{ \"type\": \"englishminimalstem\" }] }],\"fields\": [{ \"regex\": \".+\", \"analyzer\": \"StdTokLowerStem\" } ]}",
"hints": ["lengthy", "advanced", "code/json"],
"minLength": 1
},
"countField": {
"type": "string",
"title": "Event Count Field Name",
"description": "Specifies the field containing event counts used to rank queries by frequency. Maps the `count_i` field by default. Adjust to match the actual count field in your signals or aggregation collection.",
"default": "count_i",
"minLength": 1
},
"mainType": {
"type": "string",
"title": "Main Event Type",
"description": "Specifies the primary signal event type (such as `click`) used to define head and tail query boundaries. Queries are ranked by total occurrences of this event type to determine head versus tail classification.",
"default": "click",
"minLength": 1
},
"filterType": {
"type": "string",
"title": "Filtering Event Type",
"description": "Specifies the secondary event type (such as `response`) used to filter out rare searches before head/tail analysis. Leave blank if filtering by search frequency is not needed. Ensure the collection contains `type:response` records when using the default.",
"default": "response"
},
"signalTypeField": {
"type": "string",
"title": "Field Name of Signal Type",
"description": "Specifies the field containing the signal event type in the signals collection. Maps the `type` field by default. Adjust to match the actual type field in your signals schema.",
"default": "type"
},
"minCountMain": {
"type": "integer",
"title": "Minimum Main Event Count",
"description": "Sets the minimum number of main events (such as clicks) a query must have to be included in the analysis. Queries with fewer events than this threshold are excluded as too rare to analyze reliably.",
"default": 1
},
"minCountFilter": {
"type": "integer",
"title": "Minimum Filtering Event Count",
"description": "Sets the minimum number of filtering events (such as searches) a query must have to be included in the analysis. Queries issued fewer times than this threshold are excluded to remove low-frequency noise.",
"default": 20
},
"queryLenThreshold": {
"type": "integer",
"title": "Minimum Query Length ",
"description": "Sets the minimum number of characters a query string must have to be included in head/tail analysis. Queries shorter than this threshold are excluded as too brief to yield meaningful rewrite candidates.",
"default": 2
},
"userHead": {
"type": "number",
"title": "Head Count Threshold",
"description": "Sets the user-defined threshold separating head queries from others. Use `-1.0` to let the algorithm choose automatically. Values between 0 and 1 indicate a percentage of queries. Values greater than 1 indicate an exact query count.",
"default": -1,
"hints": ["advanced"]
},
"userTail": {
"type": "number",
"title": "Tail Count Threshold",
"description": "Sets the user-defined threshold separating tail queries from others. Use `-1.0` to let the algorithm choose automatically. Values between 0 and 1 indicate a percentage of queries. Values greater than 1 indicate an exact query count.",
"default": -1,
"hints": ["advanced"]
},
"topQ": {
"type": "array",
"title": "Top X% Head Query Event Count",
"description": "Computes the total event count contributed by the top X head queries. Provide values as fractions (0 to 1) for percentages or integers >= 1 for exact query counts. Multiple values can be provided.",
"default": [100, 0.01],
"hints": ["advanced"],
"items": {
"type": "number"
}
},
"trafficPerc": {
"type": "array",
"title": "Number of Queries that Constitute X% of Total Events",
"description": "Computes the number of distinct queries that together account for each specified fraction of total events. For example, `[0.25, 0.50]` reports how many queries generate 25% and 50% of all events.",
"default": [0.25, 0.5, 0.75],
"hints": ["advanced"],
"items": {
"type": "number"
}
},
"lastTraffic": {
"type": "array",
"title": "Bottom X% Tail Query Event Count",
"description": "Computes the total number of queries that are distributed across each specified fraction of total tail events. For example, `[0.01]` reports how many queries account for the bottom 1% of events.",
"default": [0.01],
"hints": ["advanced"],
"items": {
"type": "number"
}
},
"trafficCount": {
"type": "array",
"title": "Event Count Computation Threshold",
"description": "Computes the number of queries that have fewer events than each specified value. For example, `[5.0]` returns the count of queries with fewer than 5 associated events.",
"default": [5],
"hints": ["advanced"],
"items": {
"type": "number"
}
},
"keywordsBlobName": {
"type": "string",
"title": "Keywords blob name",
"description": "Specifies the blob store resource name of a CSV file containing keywords used in tail query matching. Upload the file to the blob store in the required format before referencing it here.",
"minLength": 1,
"reference": "blob",
"blobType": "file:spark"
},
"lenScale": {
"type": "integer",
"title": "Edit Distance vs String Length Scale",
"description": "Sets the scaling factor used to normalize query string length when computing edit distance thresholds. Larger values restrict spelling matches to queries with very small edit distances relative to their length.",
"default": 6,
"hints": ["advanced"]
},
"overlapThreshold": {
"type": "integer",
"title": "Head and tail Overlap threshold",
"description": "Sets the minimum number of overlapping tokens required between a head and tail query for the pair to be considered a rewrite candidate. Pairs with fewer overlapping tokens than this threshold are excluded.",
"default": 4,
"hints": ["advanced"]
},
"overlapNumBoost": {
"type": "number",
"title": "Token Overlap Number Boost",
"description": "Sets the weight applied to token overlap count when ranking multiple head matches for a tail query. Larger values prioritize heads with more matching tokens over heads with higher query frequency. This field is hidden.",
"default": 10,
"hints": ["hidden", "advanced"]
},
"headQueryCntBoost": {
"type": "number",
"title": "Head query count boost",
"description": "Sets the weight applied to head query frequency when ranking multiple head matches for a tail query. Larger values favor the most popular head queries over those with more token overlap. This field is hidden.",
"default": 1,
"hints": ["hidden", "advanced"]
},
"tailRewrite": {
"type": "boolean",
"title": "Generate tail rewrite table",
"description": "Controls whether a tail rewrite table is generated alongside the distribution analysis. Set to `false` on the first run to review head and tail positions before generating rewrites.",
"default": true,
"hints": ["advanced"]
},
"sparkPartitions": {
"type": "integer",
"title": "Set minimum Spark partitions for input",
"description": "Sets the minimum number of Spark partitions used when reading input signals data. Increasing this value improves parallelism for very large signals collections. The default of `200` works for most datasets.",
"default": 200,
"hints": ["advanced"]
},
"stopwordsList": {
"type": "array",
"title": "List of stopwords",
"description": "Lists stopword blob resources defined in the Lucene analyzer configuration. This field is read-only and hidden. Stopwords are controlled via the `analyzerConfigQuery` field.",
"hints": ["readonly", "hidden"],
"items": {
"type": "string",
"minLength": 1,
"reference": "blob",
"blobType": "file:spark"
}
},
"enableAutoPublish": {
"type": "boolean",
"title": "Enable auto-publishing",
"description": "Controls whether generated tail rewrite rules are automatically published to the rules engine. When `false`, rules require manual review before publishing. Set to `true` only after validating rewrite quality.",
"default": false,
"hints": ["advanced"]
},
"type": {
"type": "string",
"title": "Spark Job Type",
"enum": ["headTailAnalysis"],
"default": "headTailAnalysis",
"hints": ["readonly"]
}
},
"additionalProperties": true,
"category": "Other",
"categoryPriority": 1,
"propertyGroups": [{
"label": "Input/Output Parameters",
"properties": ["trainingCollection", "outputCollection", "dataFormat", "trainingDataFilterQuery", "readOptions", "writeOptions", "trainingDataFrameConfigOptions", "trainingDataSamplingFraction", "randomSeed"]
}, {
"label": "Field Parameters",
"properties": ["fieldToVectorize", "sourceFields", "signalTypeField", "mainType", "filterType", "countField"]
}, {
"label": "Model Tuning Parameters",
"properties": ["minCountMain", "minCountFilter", "tailRewrite", "userHead", "userTail", "lenScale", "overlapThreshold", "topQ", "trafficCount", "trafficPerc", "lastTraffic"]
}, {
"label": "Featurization Parameters",
"properties": ["analyzerConfigQuery", "queryLenThreshold"]
}, {
"label": "Misc. Parameters",
"properties": ["keywordsBlobName"]
}]
};
export const SchemaParamFields = ({schema}) => {
const sanitize = str => {
if (typeof str !== "string") return str;
return str.replace(/^"(.*)"$/s, "$1").replace(/\\/g, "").replace(/"/g, "'");
};
const renderMd = str => {
const s = sanitize(str);
const text = (/[.!?]\)*$/).test(s) ? s : `${s}.`;
return text.split(/(\*\*[^*]+\*\*|_[^_]+_|`[^`]+`)/g).map((part, i) => {
if (part.startsWith("**")) return {part.slice(2, -2)};
if (part.startsWith("_")) return {part.slice(1, -1)};
if (part.startsWith("`")) return {part.slice(1, -1)};
return part;
});
};
const {description, properties = {}, required: requiredProps = []} = schema;
const visibleProps = useMemo(() => Object.entries(properties).filter(([, prop]) => !prop.hints?.includes("hidden")), [properties]);
const renderProp = ([name, prop]) => {
const isRequired = requiredProps.includes(name);
const hasDefault = prop.default !== undefined;
const rawDefault = prop.default;
const hints = prop.hints || [];
const isComplexDefault = hasDefault && (typeof rawDefault === "object" || typeof rawDefault === "string" && (rawDefault.length > 20 || rawDefault.includes('"')));
const postBadges = [];
if (prop.title) {
postBadges.push(<>API property: {name});
}
const constraints = [];
if (prop.minimum !== undefined && prop.maximum !== undefined) {
constraints.push(`Range: ${prop.minimum} – ${prop.maximum}`);
} else if (prop.minimum !== undefined) {
constraints.push(`Min: ${prop.minimum}`);
} else if (prop.maximum !== undefined) {
constraints.push(`Max: ${prop.maximum}`);
}
if (prop.minLength !== undefined && prop.maxLength !== undefined) {
constraints.push(`Length: ${prop.minLength} – ${prop.maxLength}`);
} else if (prop.minLength !== undefined) {
constraints.push(`Min length: ${prop.minLength}`);
} else if (prop.maxLength !== undefined) {
constraints.push(`Max length: ${prop.maxLength}`);
}
const fieldProps = {
key: name,
body: prop.title || name,
type: prop.type,
...postBadges.length > 0 && ({
post: postBadges
}),
...isRequired && ({
required: true
}),
...!isComplexDefault && hasDefault ? {
default: sanitize(String(rawDefault))
} : {}
};
const isObject = prop.type === "object" && prop.properties;
const isArrayOfObjects = prop.type === "array" && prop.items?.type === "object" && prop.items.properties;
return
{prop.description &&
{isLoaded && `
}} />}
Powered by Lucidworks Agent Studio
;
};
export const InlineImage = ({src, alt = '', height = '2em'}) => {
return ;
};
[localhost link]: http://localhost:3000/docs/5/fusion/reference/config-ref/jobs/head-tail-analysis
[mintlify link]: https://doc.lucidworks.com/docs/5/fusion/reference/config-ref/jobs/head-tail-analysis
[old doc.lw link]: https://doc.lucidworks.com/fusion/5.9/552
Perform head/tail analysis of queries from collections of raw or aggregated signals, to identify underperforming queries and the reasons. This information is valuable for improving overall conversions, Solr configurations, auto-suggest, product catalogs, and SEO/SEM strategies, in order to improve conversion rates.
This job is deprecated in Fusion 5.9.15 and will be removed in a future release.
Lucidworks recommends migrating to [Neural Hybrid Search](/docs/5/fusion/hybrid-search/overview), which achieves superior relevance compared to legacy machine learning methods.
The course for **Resolving Underperforming Queries** focuses on tips for tuning, running, and cleaning up Fusion’s query rewrite jobs.
| | |
| -------------------- | ----------------------------------------------------------------------------------------------------------------------------------------------------------------------------- |
| **Default job name** | `COLLECTION_NAME_head_tail` |
| **Input** | Raw or aggregated signals (the `COLLECTION_NAME_signals` or `COLLECTION_NAME_signals_aggr` collections by default) |
| **Output** | ● Rewrites for underperforming queries (the `_query_rewrite_staging` collection by default) ● Analytics tables (the `COLLECTION_NAME_job_reports` collection by default) |
| | query | count\_i | type | timestamp\_tdt | user\_id | doc\_id | session\_id | fusion\_query\_id |
| ------------------------ | ----- | -------- | ---- | -------------- | -------- | ------- | ----------- | ----------------- |
| Required signals fields: | ✅ | ✅ | ✅ | | | | | |
A minimum of 10,000 signals is required to successfully run this job.
You can review the output from this job by navigating to **Relevance** > **Rules** > **Rewrite** > **Head/Tail**. See [Underperforming query rewriting](/docs/5/fusion/getting-data-out/query-enhancement/query-rewriting) for more information.
## Head/tail analysis configuration
The job configuration must specify the following:
* The [signals](/docs/5/fusion/getting-data-out/query-enhancement/signals/overview) collection (the **Input Collection** parameter)\
Signals can be raw (the `COLLECTION_NAME_signals` collection) or [aggregated](/docs/5/fusion/reference/config-ref/jobs/aggregations/overview) (the `_signals_aggr` collection).
* The query string field (the **Query Field Name** parameter)
* The event count field\
For example, if signal data follows the default Fusion setup, then `count_i` is the field that records the count of raw signals and `aggr_count_i` is the field that records the count after aggregation.
The job allows you to analyze query performance based on two different events:
* The main event (the `mainType`/**Main Event Type** parameter)
* The filtering/secondary event (the `filterType`/**Filtering Event Type** parameter)\
If you only have one event type, leave this parameter empty.
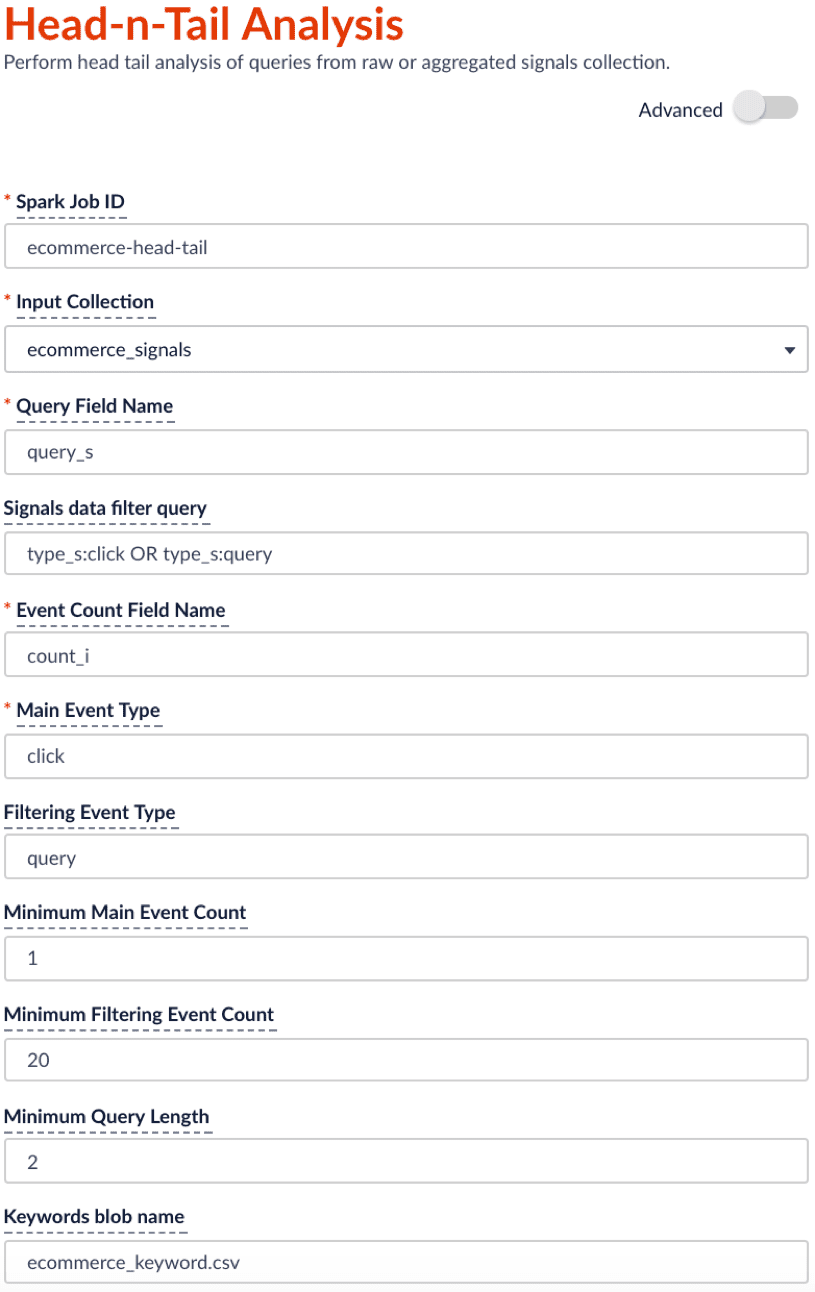
For example, if you specify the main event to be clicks with minimum count of 0 and the filtering event to be queries with minimum count of 20, then the job will filter on the queries that get searched at least 20 times and check among those popular searched queries to see which ones didn’t get clicked at all or only a few times.
An example configuration is shown below:
The suggested schedule for this head-n-tail analysis job is to run bi-weekly or monthly. You can change schedule under the run panel.
## Job output
By default, the output collection is the `_job_reports` collection. The head/tail job adds a set of analytics results tables to the collection. You can find these table names in the `doc_type_s` field of each document:
* `overall_distribution`
* `summary_stat`
* `queries_ordered`
* `tokens_ordered`
* `queryLength`
* `tail_reasons`
* `tail_rewriting`
You can use [App Insights](/docs/5/fusion/getting-data-out/data-analytics/app-insights/overview) to visualize each of these tables:
1. In the Fusion workspace, navigate to **Analytics** > **App Insights**.\
The App Insights dashboard appears.
2. On the left, click **Analytics** .
3. Under **Standard Reports**, click **Head Tail analysis**.\
The Head/Tail Analysis job output tables appear. These are described in more detail below.
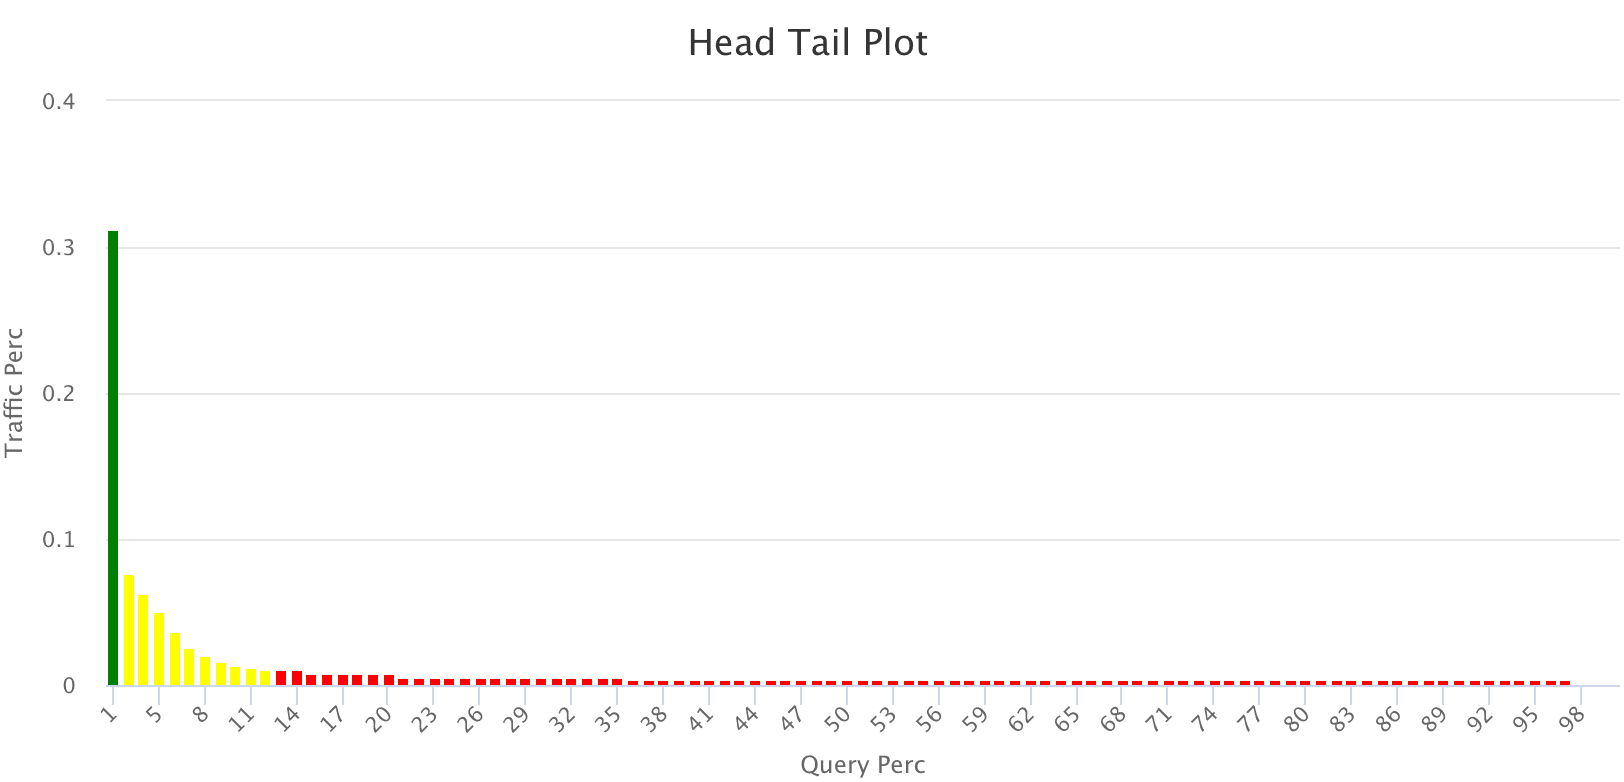
### Head/Tail Plot (`overall_distribution`)
This head/tail distribution plot provides an overview of the query traffic distribution. In order to provide better visualization, the unique queries are in descending order based on traffic and put into bins of 100 queries on the x axis, with the sum of traffic coming from each bin on the y axis.
For example, the head/tail distribution plot below shows a long tail, indicating that the majority of queries produce very little traffic. The goal of analyzing this data is to shorten that tail, so that a higher proportion of your queries produce traffic.
* Green = head
* Yellow = torso
* Red = tail
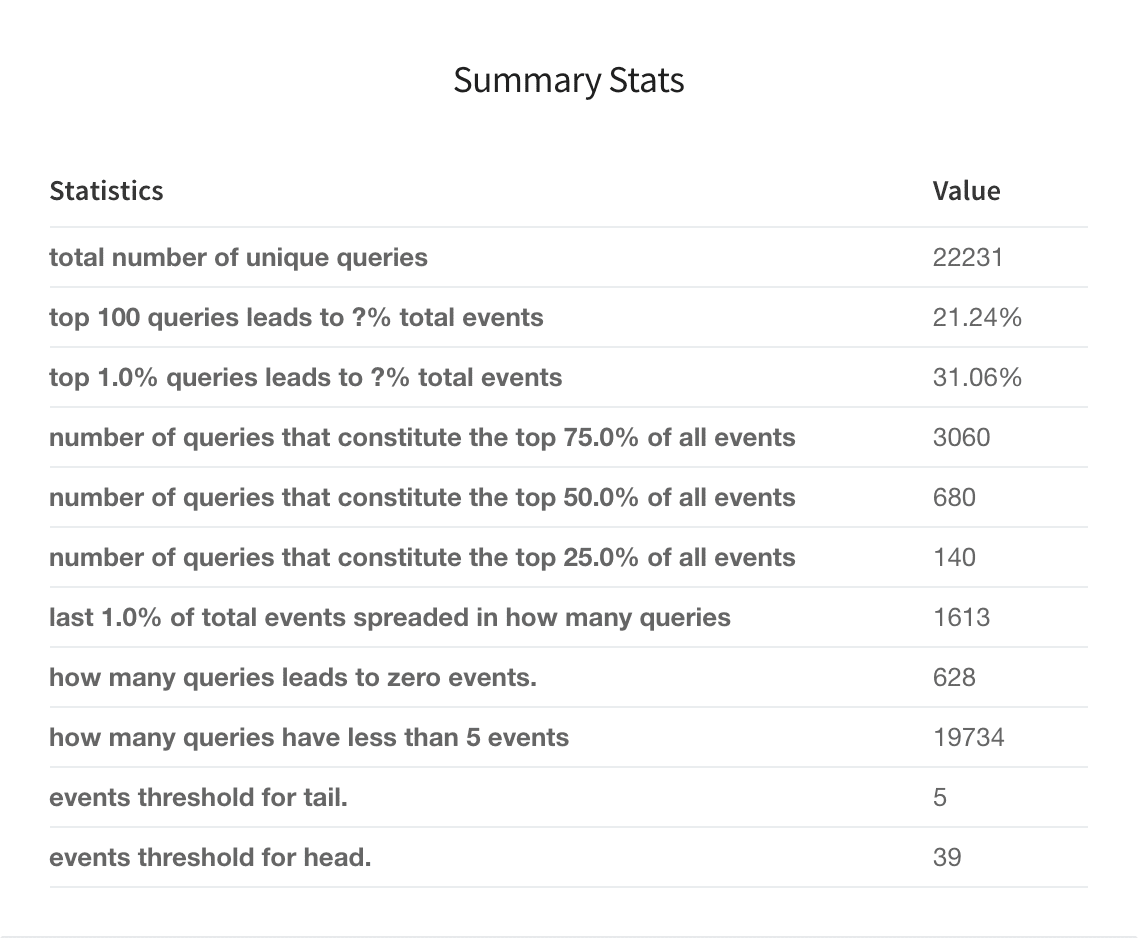
### Summary Stats (`summary_stat`)
This user-configurable summary statistics table shows how much traffic is produced by various query groups, to help understand the head/tail distribution.
You can configure this table before running the job. Click **Advanced** in the Head/Tail Analysis job configuration panel, then tune these parameters:
* Top X% Head Query Event Count (`topQ`)
* Number of Queries that Constitute X% of Total Events (`trafficPerc`)
* Bottom X% Tail Query Event Count (`lastTraffic`)
* Event Count Computation Threshold (`trafficCount`)
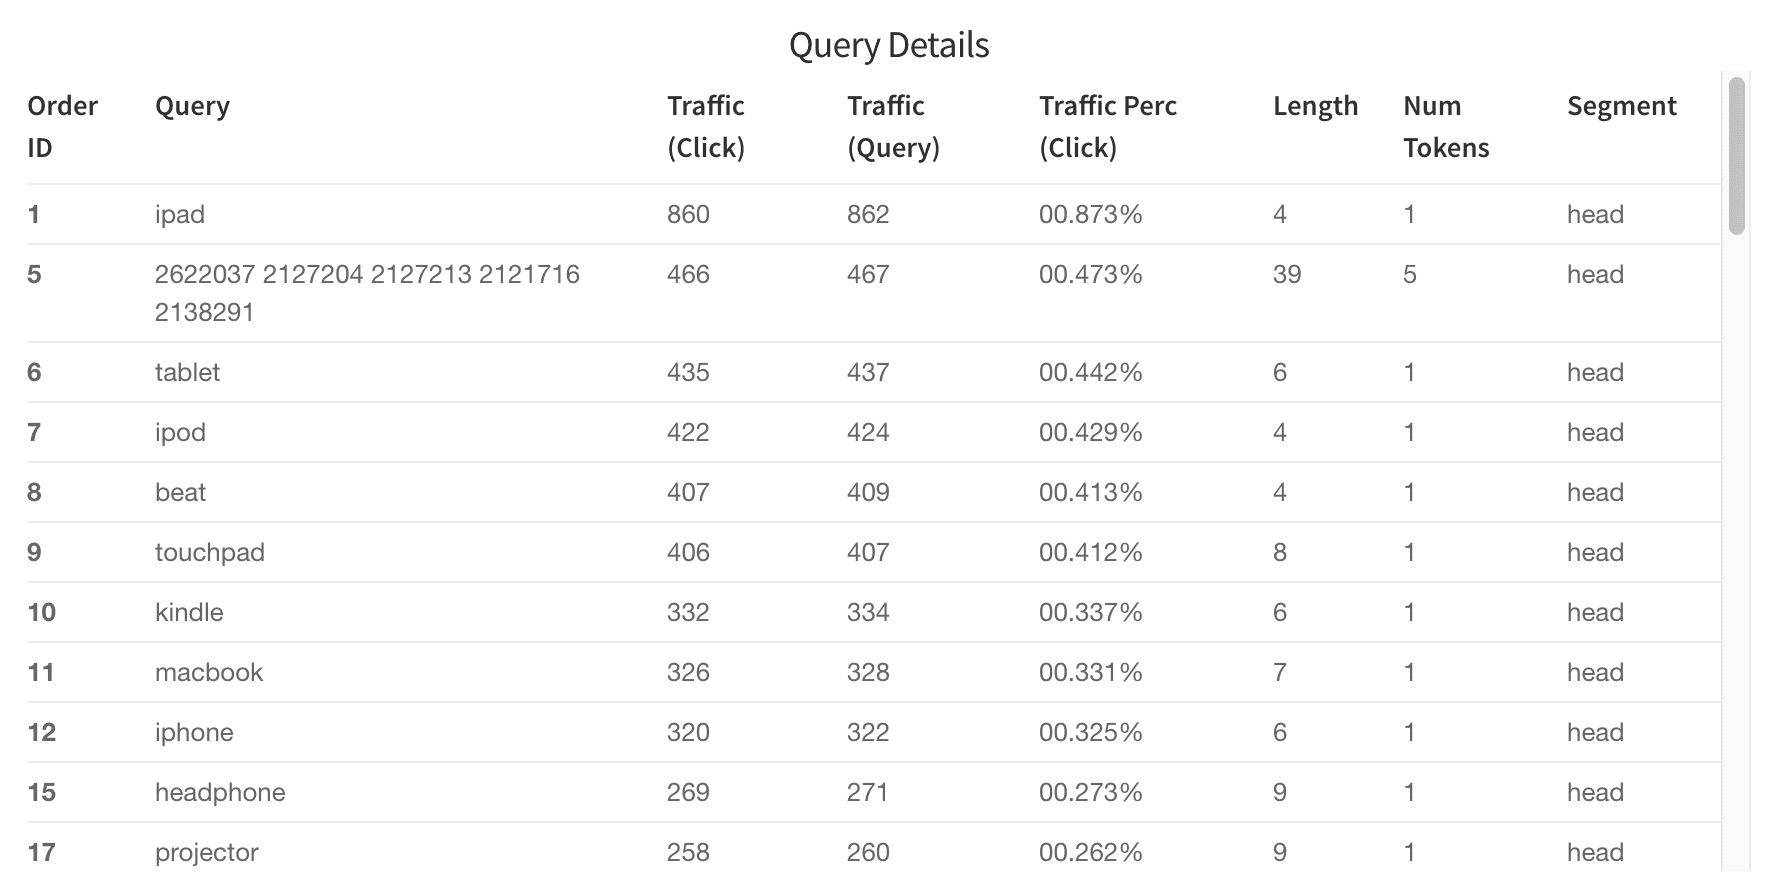
### Query Details (`queries_ordered`)
The Query Details table helps you discover which queries are the best performers and which are worst. You can filter results by issuing a search in the search bar. For example, search "segment\_s:tail" to get tail queries or search "num\_events\_l:0" to get zero results queries. (Note: field names are listed in the "what is this" toolkit).
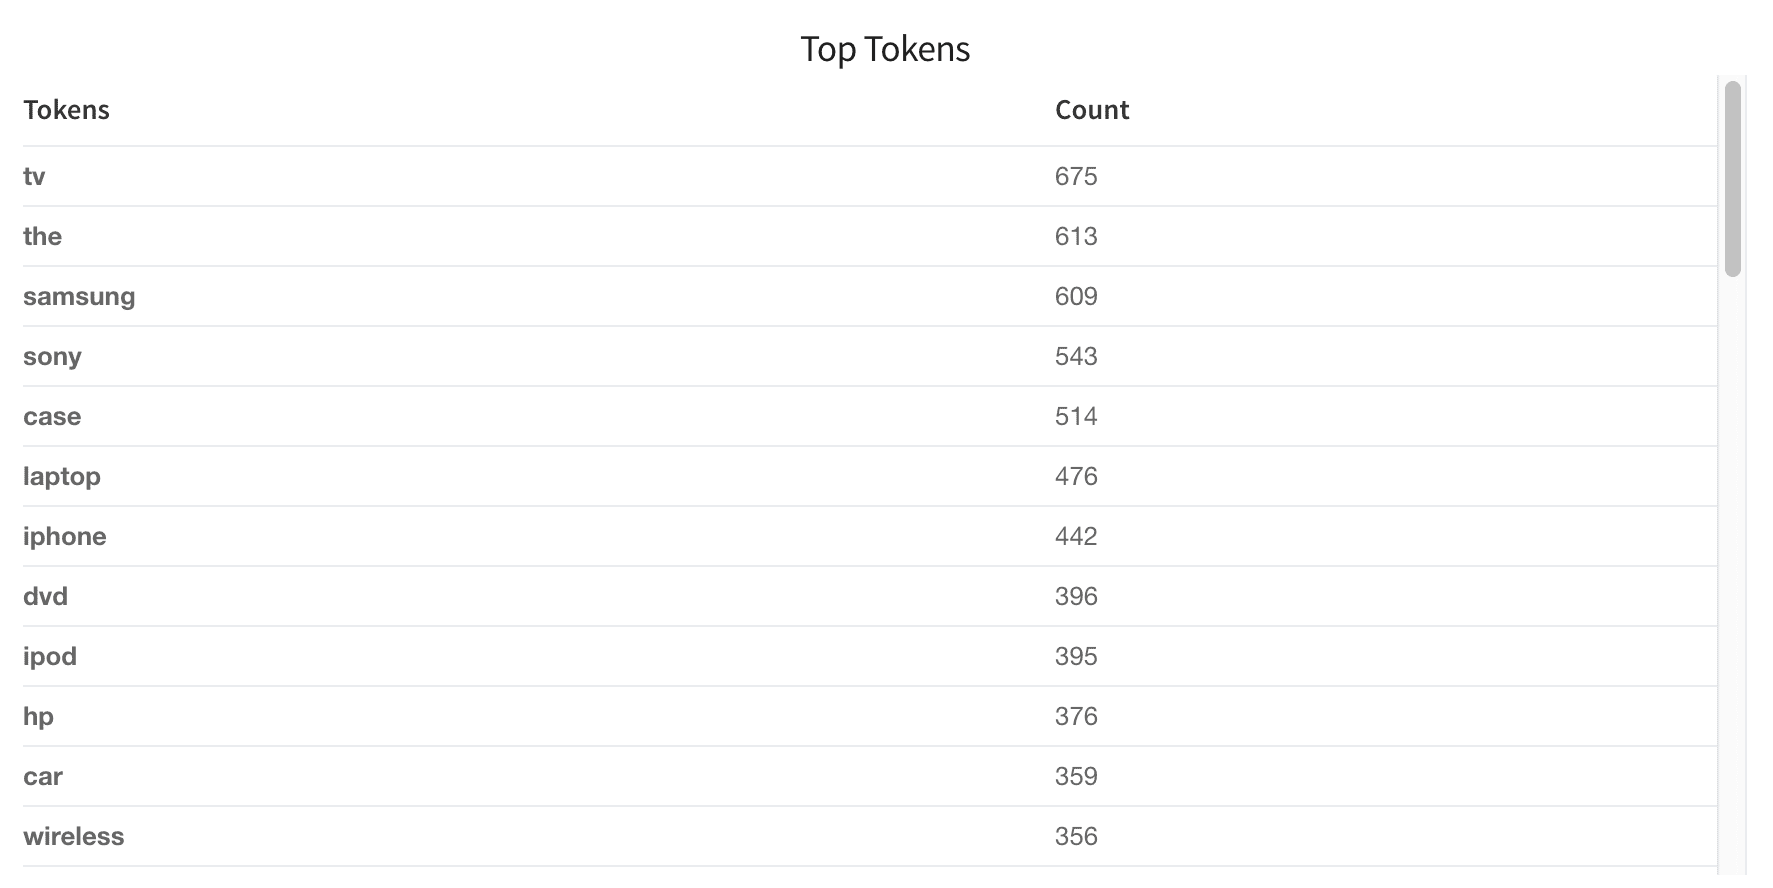
### Top Tokens (`tokens_ordered`)
The "Top Tokens" table lists the number of times each token shown in the queries.
### Query Length (`queryLength`)
This table shows how users are querying your database. Are most people searching very long strings or very short strings? These distributions will give you insight into how to tune your search engine to be performant on the majority of queries.
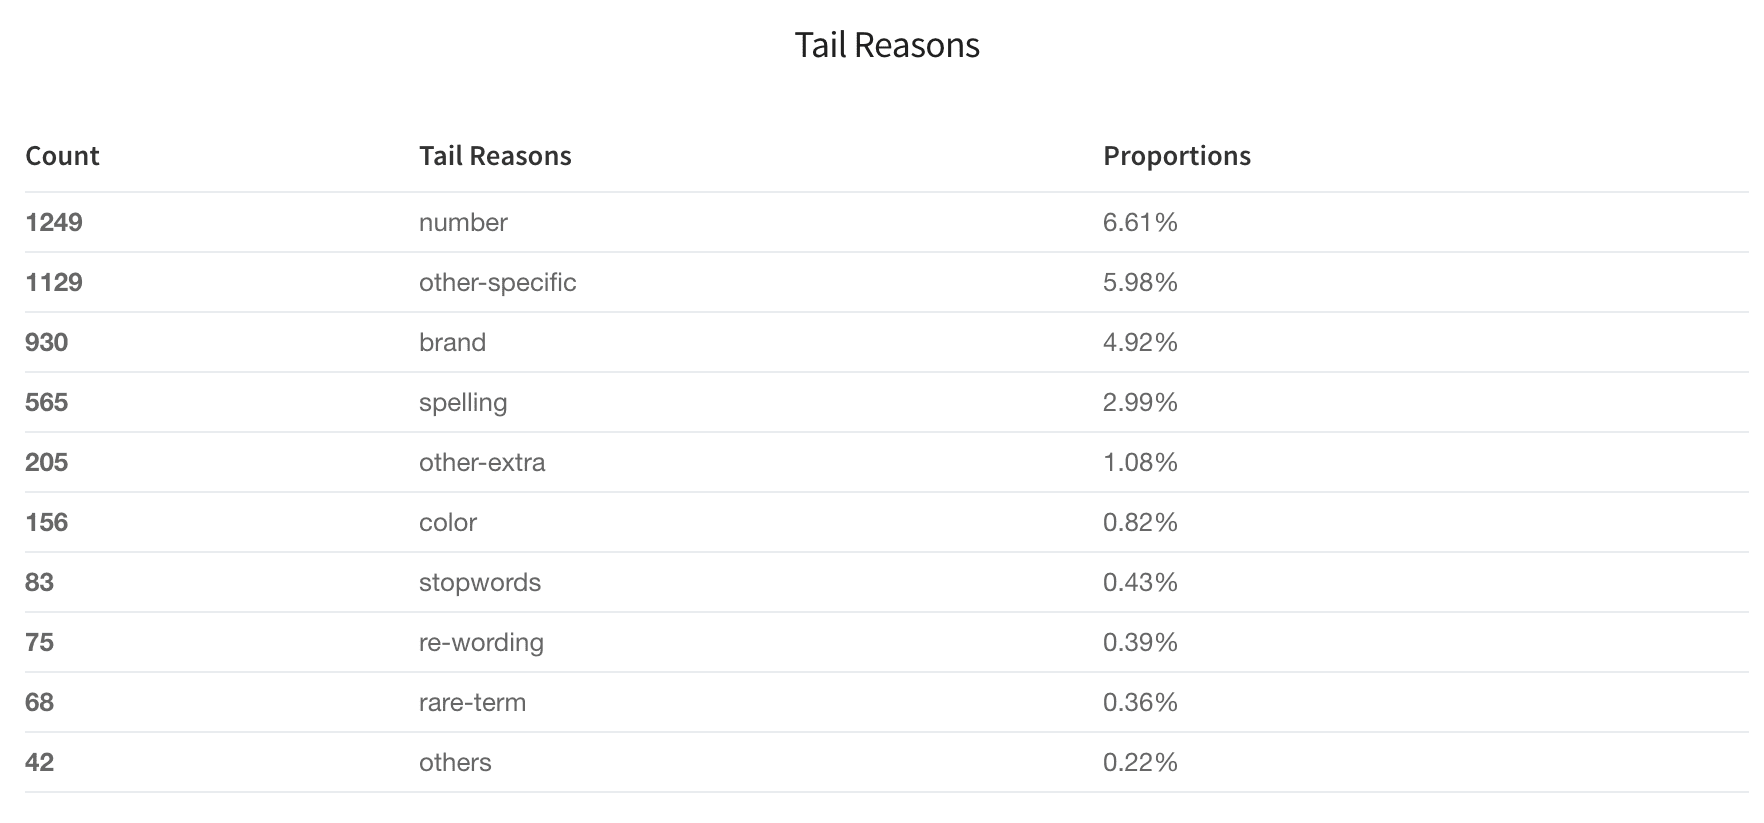
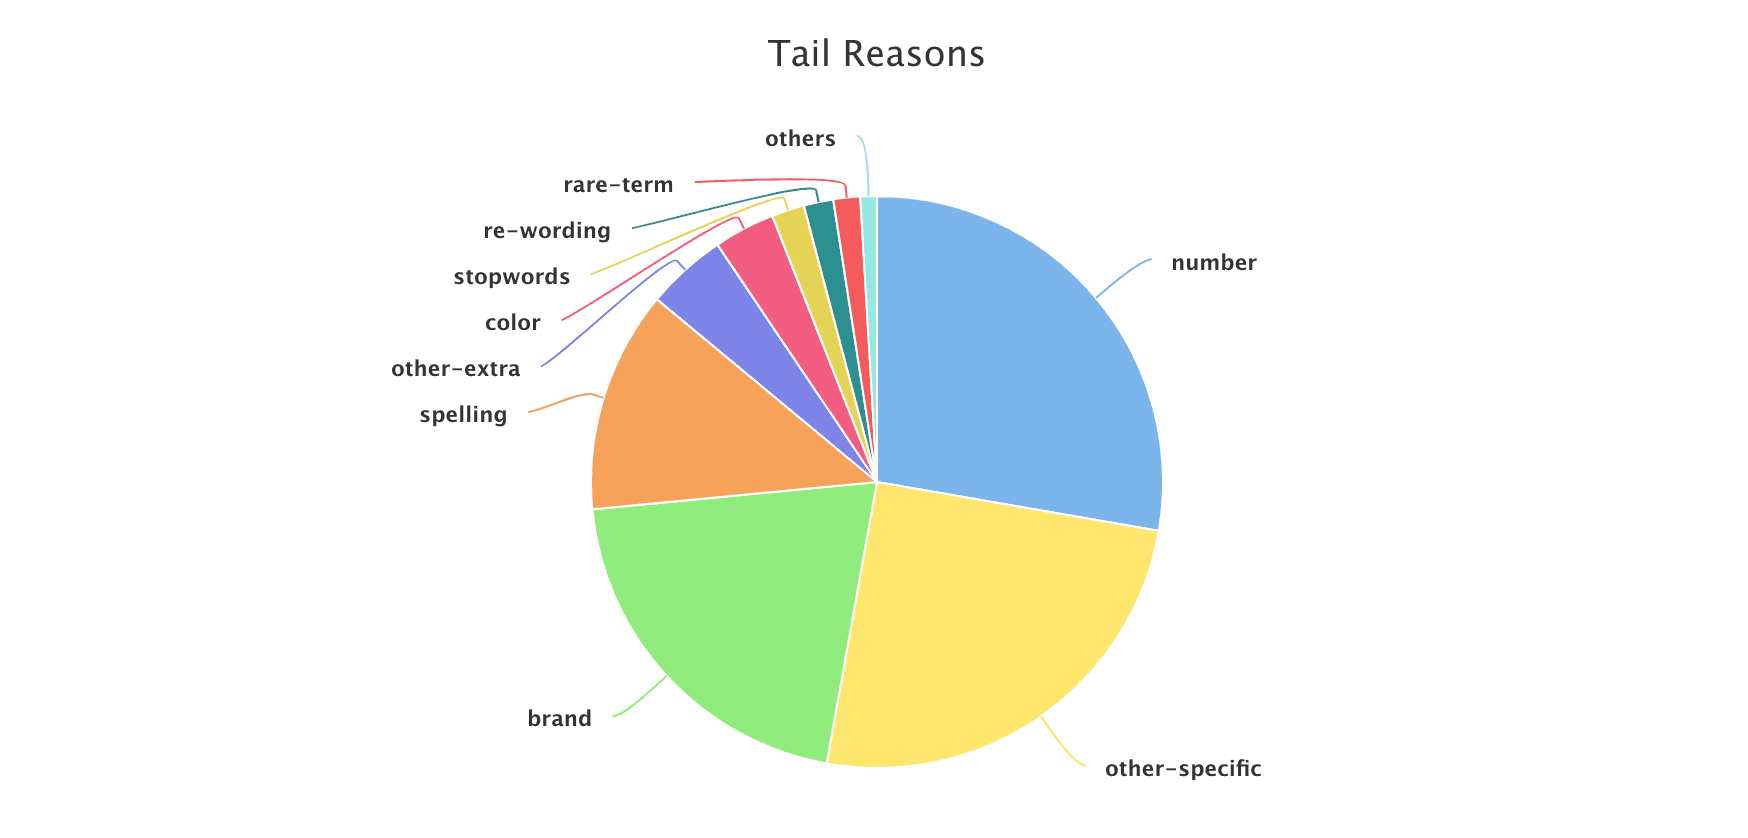
### Tail Reasons table and pie chart (`tail_reasons`)
Based on the difference between the tail and head queries, the Head/Tail Analysis job assigns probable reasons for why any given query is a tail query. Tail reasons are displayed as both a table and a pie chart:
#### Pre-defined tail reasons
Based on Lucidworks' observations on different signal datasets, we summarize tail reasons into several pre-defined categories:
| | |
| -------------- | ------------------------------------------------------------------------------------------------------------------------------------------------------------------------------------------------------------------------------------------------------------------------------------------------------------ |
| spelling | The query contains one or more misspellings; we can apply spelling suggestions based on the matching head. |
| number | The query contains an attribute search on a specific dimension. To normalize these queries we can parse the number to deal with different formatting, and/or pay attention to unit synonyms or enrich the product catalog. For example, "3x5" should be converted to "3’ X 5’" to match the dimension field. |
| other-specific | The query contains specific descriptive words plus a head query, which means the user is searching for a very specific product or has a specific requirement. We can boost on the specific part for better relevancy. |
| other-extra | This is similar to ‘other-specific’ but the descriptive part may lead to ambiguity, so it requires boosting the head query portion of the query instead of the specific or descriptive words. |
| rare-term | The user is searching for a rare item; use caution when boosting. |
| re-wording | The query contains a sequence of terms in a less-common order. Flipping the word order to a more common one can change a tail query to a head query, and allows for consistent boosting on the last term in many cases. |
| stopwords | Query contains stopwords plus head query. We would need to drop stopwords. |
#### Custom dictionary
You can also specify your own attributes through a keywords file in CSV format. The header of the CSV file must be called "keyword" and "type", and stopwords must be called "stopword" for the program to recognize them.
Below is an example dictionary that defines "color" and "brand" reason types. The job will parse the tail query, assign reasons such as "color" or "brand", and perform filtering or focused search on these fields. (Note: color and brand are also the field names in your catalog.)
```csv theme={"dark"}
keyword,type
a,stopword
an,stopword
and,stopword
blue,color
white,color
black,color
hp,brand
samsung,brand
sony,brand
```
**How to install a custom dictionary**
1. Construct the CSV file as described above.
2. [Upload the CSV file to the blob store](/docs/5/fusion/getting-data-in/blob-storage).\
Note the blob ID.
3. In the Head/Tail Analysis job configuration, enter the blob ID in the **Keywords blob name** (`keywordsBlobName`) field.
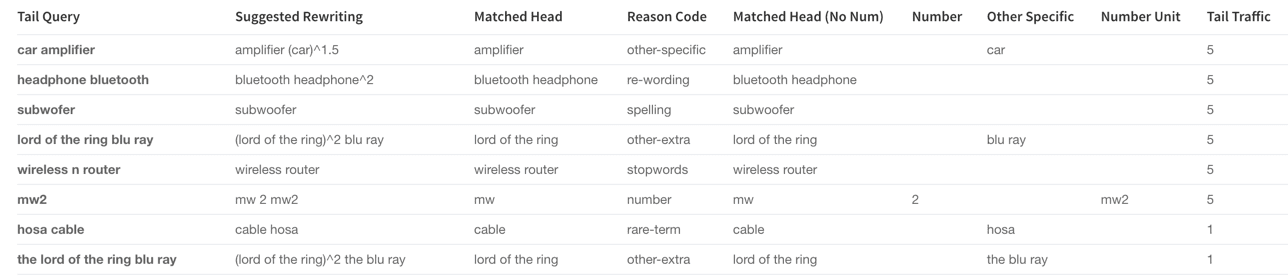
### Head Tail Similarity (`tail_rewriting`)
For each tail query (the `tailQuery_orig` field), Fusion tries to find its closest matching head queries (the `headQuery_orig` field), then suggests a query rewrite (the `suggested_query` field) which would improve the query. The rewrite suggestions in this table can be implemented in a variety of ways, including utilizing rules editor or configuring a query parser that rewrites tail queries.
## Configuration properties
 * Green = head
* Yellow = torso
* Red = tail
### Summary Stats (`summary_stat`)
This user-configurable summary statistics table shows how much traffic is produced by various query groups, to help understand the head/tail distribution.
* Green = head
* Yellow = torso
* Red = tail
### Summary Stats (`summary_stat`)
This user-configurable summary statistics table shows how much traffic is produced by various query groups, to help understand the head/tail distribution.
 You can configure this table before running the job. Click **Advanced** in the Head/Tail Analysis job configuration panel, then tune these parameters:
* Top X% Head Query Event Count (`topQ`)
* Number of Queries that Constitute X% of Total Events (`trafficPerc`)
* Bottom X% Tail Query Event Count (`lastTraffic`)
* Event Count Computation Threshold (`trafficCount`)
### Query Details (`queries_ordered`)
The Query Details table helps you discover which queries are the best performers and which are worst. You can filter results by issuing a search in the search bar. For example, search "segment\_s:tail" to get tail queries or search "num\_events\_l:0" to get zero results queries. (Note: field names are listed in the "what is this" toolkit).
You can configure this table before running the job. Click **Advanced** in the Head/Tail Analysis job configuration panel, then tune these parameters:
* Top X% Head Query Event Count (`topQ`)
* Number of Queries that Constitute X% of Total Events (`trafficPerc`)
* Bottom X% Tail Query Event Count (`lastTraffic`)
* Event Count Computation Threshold (`trafficCount`)
### Query Details (`queries_ordered`)
The Query Details table helps you discover which queries are the best performers and which are worst. You can filter results by issuing a search in the search bar. For example, search "segment\_s:tail" to get tail queries or search "num\_events\_l:0" to get zero results queries. (Note: field names are listed in the "what is this" toolkit).
 ### Top Tokens (`tokens_ordered`)
The "Top Tokens" table lists the number of times each token shown in the queries.
### Top Tokens (`tokens_ordered`)
The "Top Tokens" table lists the number of times each token shown in the queries.
 ### Query Length (`queryLength`)
This table shows how users are querying your database. Are most people searching very long strings or very short strings? These distributions will give you insight into how to tune your search engine to be performant on the majority of queries.
### Query Length (`queryLength`)
This table shows how users are querying your database. Are most people searching very long strings or very short strings? These distributions will give you insight into how to tune your search engine to be performant on the majority of queries.
 ### Tail Reasons table and pie chart (`tail_reasons`)
Based on the difference between the tail and head queries, the Head/Tail Analysis job assigns probable reasons for why any given query is a tail query. Tail reasons are displayed as both a table and a pie chart:
### Tail Reasons table and pie chart (`tail_reasons`)
Based on the difference between the tail and head queries, the Head/Tail Analysis job assigns probable reasons for why any given query is a tail query. Tail reasons are displayed as both a table and a pie chart:
 #### Pre-defined tail reasons
Based on Lucidworks' observations on different signal datasets, we summarize tail reasons into several pre-defined categories:
| | |
| -------------- | ------------------------------------------------------------------------------------------------------------------------------------------------------------------------------------------------------------------------------------------------------------------------------------------------------------ |
| spelling | The query contains one or more misspellings; we can apply spelling suggestions based on the matching head. |
| number | The query contains an attribute search on a specific dimension. To normalize these queries we can parse the number to deal with different formatting, and/or pay attention to unit synonyms or enrich the product catalog. For example, "3x5" should be converted to "3’ X 5’" to match the dimension field. |
| other-specific | The query contains specific descriptive words plus a head query, which means the user is searching for a very specific product or has a specific requirement. We can boost on the specific part for better relevancy. |
| other-extra | This is similar to ‘other-specific’ but the descriptive part may lead to ambiguity, so it requires boosting the head query portion of the query instead of the specific or descriptive words. |
| rare-term | The user is searching for a rare item; use caution when boosting. |
| re-wording | The query contains a sequence of terms in a less-common order. Flipping the word order to a more common one can change a tail query to a head query, and allows for consistent boosting on the last term in many cases. |
| stopwords | Query contains stopwords plus head query. We would need to drop stopwords. |
#### Custom dictionary
You can also specify your own attributes through a keywords file in CSV format. The header of the CSV file must be called "keyword" and "type", and stopwords must be called "stopword" for the program to recognize them.
Below is an example dictionary that defines "color" and "brand" reason types. The job will parse the tail query, assign reasons such as "color" or "brand", and perform filtering or focused search on these fields. (Note: color and brand are also the field names in your catalog.)
```csv theme={"dark"}
keyword,type
a,stopword
an,stopword
and,stopword
blue,color
white,color
black,color
hp,brand
samsung,brand
sony,brand
```
**How to install a custom dictionary**
1. Construct the CSV file as described above.
2. [Upload the CSV file to the blob store](/docs/5/fusion/getting-data-in/blob-storage).\
Note the blob ID.
3. In the Head/Tail Analysis job configuration, enter the blob ID in the **Keywords blob name** (`keywordsBlobName`) field.
### Head Tail Similarity (`tail_rewriting`)
For each tail query (the `tailQuery_orig` field), Fusion tries to find its closest matching head queries (the `headQuery_orig` field), then suggests a query rewrite (the `suggested_query` field) which would improve the query. The rewrite suggestions in this table can be implemented in a variety of ways, including utilizing rules editor or configuring a query parser that rewrites tail queries.
#### Pre-defined tail reasons
Based on Lucidworks' observations on different signal datasets, we summarize tail reasons into several pre-defined categories:
| | |
| -------------- | ------------------------------------------------------------------------------------------------------------------------------------------------------------------------------------------------------------------------------------------------------------------------------------------------------------ |
| spelling | The query contains one or more misspellings; we can apply spelling suggestions based on the matching head. |
| number | The query contains an attribute search on a specific dimension. To normalize these queries we can parse the number to deal with different formatting, and/or pay attention to unit synonyms or enrich the product catalog. For example, "3x5" should be converted to "3’ X 5’" to match the dimension field. |
| other-specific | The query contains specific descriptive words plus a head query, which means the user is searching for a very specific product or has a specific requirement. We can boost on the specific part for better relevancy. |
| other-extra | This is similar to ‘other-specific’ but the descriptive part may lead to ambiguity, so it requires boosting the head query portion of the query instead of the specific or descriptive words. |
| rare-term | The user is searching for a rare item; use caution when boosting. |
| re-wording | The query contains a sequence of terms in a less-common order. Flipping the word order to a more common one can change a tail query to a head query, and allows for consistent boosting on the last term in many cases. |
| stopwords | Query contains stopwords plus head query. We would need to drop stopwords. |
#### Custom dictionary
You can also specify your own attributes through a keywords file in CSV format. The header of the CSV file must be called "keyword" and "type", and stopwords must be called "stopword" for the program to recognize them.
Below is an example dictionary that defines "color" and "brand" reason types. The job will parse the tail query, assign reasons such as "color" or "brand", and perform filtering or focused search on these fields. (Note: color and brand are also the field names in your catalog.)
```csv theme={"dark"}
keyword,type
a,stopword
an,stopword
and,stopword
blue,color
white,color
black,color
hp,brand
samsung,brand
sony,brand
```
**How to install a custom dictionary**
1. Construct the CSV file as described above.
2. [Upload the CSV file to the blob store](/docs/5/fusion/getting-data-in/blob-storage).\
Note the blob ID.
3. In the Head/Tail Analysis job configuration, enter the blob ID in the **Keywords blob name** (`keywordsBlobName`) field.
### Head Tail Similarity (`tail_rewriting`)
For each tail query (the `tailQuery_orig` field), Fusion tries to find its closest matching head queries (the `headQuery_orig` field), then suggests a query rewrite (the `suggested_query` field) which would improve the query. The rewrite suggestions in this table can be implemented in a variety of ways, including utilizing rules editor or configuring a query parser that rewrites tail queries.
 ## Configuration properties