> ## Documentation Index
> Fetch the complete documentation index at: https://doc.lucidworks.com/llms.txt
> Use this file to discover all available pages before exploring further.
# Chart Tooltips
export const LwTemplate = ({title = "Key questions to get you started", icon = "sparkles", cta = "Powered by Agent Studio", linkHref = "https://lucidworks.com/demo/?utm_source=docs&utm_medium=referral&utm_campaign=docs_cta_ai"}) => {
const [isLoaded, setIsLoaded] = useState(false);
useEffect(() => {
const timer = setTimeout(() => {
setIsLoaded(true);
}, 500);
return () => clearTimeout(timer);
}, []);
return
{isLoaded && `
}} />}
Powered by Lucidworks Agent Studio
;
};
[old doc.lw link]: https//doc.lucidworks.com/app-studio/4.2/3144
[localhost link]: http://localhost:3000/docs/5/app-studio/reference/modules/visualisations/chart-tooltips
[mintlify link]: https://doc.lucidworks.com/docs/5/app-studio/reference/modules/visualisations/chart-tooltips
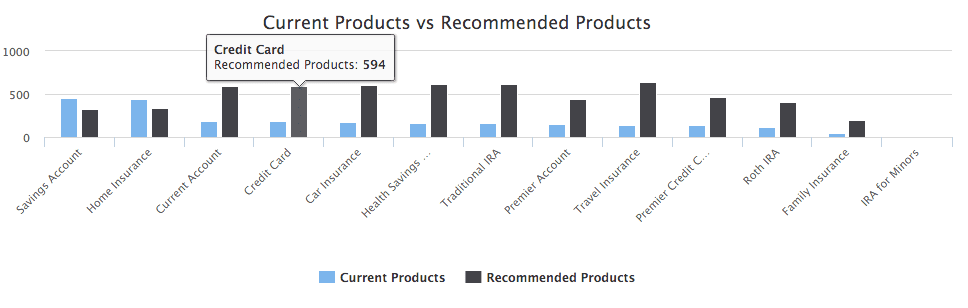
## Tooltips
Tooltips display information when you hover over a point or area of the chart. Tooltips can be set across the whole chart or specifically to a series using the Chart Tooltip tag.
This tag must be nested in the [Chart Display tag](/docs/5/fusion/dev-portal/appkit/reference/modules/visualisations/chart-display), or in either of the series tags ([Series Facet tag](/docs/5/fusion/dev-portal/appkit/reference/modules/visualisations/facet-data-series) and [Series Result List tag](/docs/5/fusion/dev-portal/appkit/reference/modules/visualisations/data-series)) if the tooltip is specific to a series.
```xml wrap theme={"dark"}
```
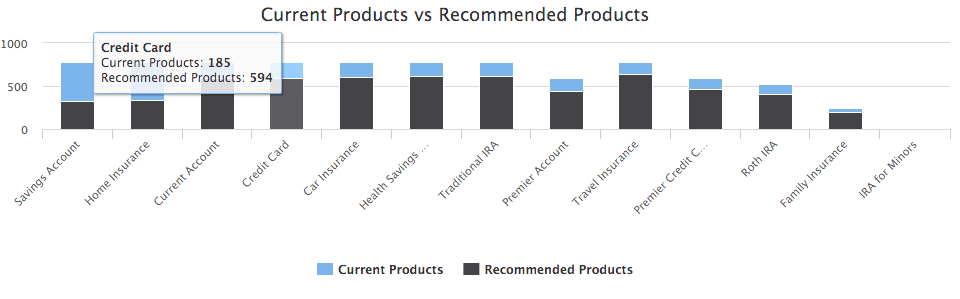
## Shared Tooltip
If you are rendering more then one series you can set the tooltip to be shared, this means it will display information about all the series for the point you have hovered over.
```xml wrap theme={"dark"}
```
To see all related attributes, see the [chart:tooltip](/docs/5/fusion/dev-portal/appkit/reference/tags/lightning.directive.chartTooltip) tag documentation.
 ## Shared Tooltip
If you are rendering more then one series you can set the tooltip to be shared, this means it will display information about all the series for the point you have hovered over.
```xml wrap theme={"dark"}
## Shared Tooltip
If you are rendering more then one series you can set the tooltip to be shared, this means it will display information about all the series for the point you have hovered over.
```xml wrap theme={"dark"}
 To see all related attributes, see the [chart:tooltip](/docs/5/fusion/dev-portal/appkit/reference/tags/lightning.directive.chartTooltip) tag documentation.