> ## Documentation Index
> Fetch the complete documentation index at: https://doc.lucidworks.com/llms.txt
> Use this file to discover all available pages before exploring further.

# series:facet

export const LwTemplate = ({title = "Key questions to get you started", icon = "sparkles", cta = "Powered by Agent Studio", linkHref = "https://lucidworks.com/demo/?utm_source=docs&utm_medium=referral&utm_campaign=docs_cta_ai"}) => {
  const [isLoaded, setIsLoaded] = useState(false);
  useEffect(() => {
    const timer = setTimeout(() => {
      setIsLoaded(true);
    }, 500);
    return () => clearTimeout(timer);
  }, []);
  return <div className="lw-template-container">
      <Card title={title} icon={icon}>
        {isLoaded && <span dangerouslySetInnerHTML={{
    __html: `<lw-template id="a029c1a9-28be-427e-b0e1-5d918920246a"></lw-template
            >`
  }} />}
        <Link href={linkHref} className="agent-studio-link text-left text-gray-600 gap-2 dark:text-gray-400 text-sm font-medium flex flex-row items-center hover:text-primary dark:hover:text-primary-light group-hover:text-primary group-hover:dark:text-primary-light">Powered by Lucidworks Agent Studio</Link>
      </Card>
    </div>;
};

[localhost link]: http://localhost:3000/docs/4/app-studio/reference/tags/lightning.directive.seriesFacet

[mintlify link]: https://doc.lucidworks.com/docs/4/app-studio/reference/tags/lightning.directive.seriesFacet

[old doc.lw link]: https://doc.lucidworks.com/app-studio/4.2/1165

<LwTemplate />

## Description

To render information in facets use the Series Facet tag, has to be
nested within a [Chart Display tag](/docs/4/app-studio/reference/tags/lightning.directive.chartDisplay).

You can use the `response` attribute to load the data from the response
or alternatively you can add a platform and this will get only the data
the series needs to be rendered. You will also need to include the
`query` directly on this tag if you wish for the user to be able to
filter using the data of this series or alternatively add the `query` to
the [Chart Display tag](/docs/4/app-studio/reference/tags/lightning.directive.chartDisplay).

For detail on how to change the color and background color see the demo
below, for more detail on what you can change and set using CSS see
[here.](http://www.highcharts.com/docs/chart-design-and-style/style-by-css)

## Usage

as element:

```xml wrap  theme={"dark"}
<series:facet
       response="{object}"
       platform="{string}"
       name="{string}"
       type="{string}"
       [title="{string}"]
       [show-marker="{string}"]
       [number-to-show="{number}"]
       [action="{string}"]
       [query="{object}"]
       [date-format="{string}"]
       [measure="{string}"]
       [selected-by-default="{boolean}"]
       [select="{string}"]>
</series:facet>
```

### Directive info

* This directive creates new scope.

#### Parameters

| Param                             | Type        | Details                                                                                                                                                                                                                                                                                                                                                                                                                                        |
| --------------------------------- | ----------- | ---------------------------------------------------------------------------------------------------------------------------------------------------------------------------------------------------------------------------------------------------------------------------------------------------------------------------------------------------------------------------------------------------------------------------------------------- |
| response                          | **object**  | A response object (please include either a response or a platform not both!).                                                                                                                                                                                                                                                                                                                                                                  |
| platform                          | **string**  | The name of the platform to get the data from (please include either a response or a platform not both!).                                                                                                                                                                                                                                                                                                                                      |
| name                              | **string**  | Name of facet.                                                                                                                                                                                                                                                                                                                                                                                                                                 |
| type                              | **string**  | Chart type                                                                                                                                                                                                                                                                                                                                                                                                                                     |
| title  *(optional)*               | **string**  | The title of the series that appears in the legend and tooltip.                                                                                                                                                                                                                                                                                                                                                                                |
| show-marker  *(optional)*         | **string**  | Whether to show marker or not.                                                                                                                                                                                                                                                                                                                                                                                                                 |
| number-to-show  *(optional)*      | **number**  | Number of filters to render on the graph.                                                                                                                                                                                                                                                                                                                                                                                                      |
| action  *(optional)*              | **string**  | The page/action to which clicking the chart should be submitted. By default the action points to the current page.                                                                                                                                                                                                                                                                                                                             |
| query  *(optional)*               | **object**  | The search query from which to build links.                                                                                                                                                                                                                                                                                                                                                                                                    |
| date-format  *(optional)*         | **string**  | How to format the date. See #/api/lightning.filter:dateFormat\[date format filter] for valid formats.                                                                                                                                                                                                                                                                                                                                          |
| measure  *(optional)*             | **string**  | What fact to use as an alternative to count as quantitative value for a filter.                                                                                                                                                                                                                                                                                                                                                                |
| selected-by-default  *(optional)* | **boolean** | Whether this series should be shown when the chart:display is using select-series="true" mode. Default: true.                                                                                                                                                                                                                                                                                                                                  |
| select  *(optional)*              | **string**  | How the data should be filtered when clicking on a part of the chart, a valid query must be present.  Valid values:  <br />● **false**  User selects a filter by clicking the value;  **(default)**  <br />● **multiselect**  Supports selecting multiple filters that get combined with an 'OR'.  <br />● **multiselect-instant**  Supports selecting multiple filters that get combined with an 'OR', filters will be applied automatically. |

## Example

#### Source

```xml wrap  expandable  theme={"dark"}
<chart:display response="response" title="Files Indexed" subtitle="Per Day" type="bar">
    <series:facet name="test1" title="First Pass"></series:facet>
    <series:facet name="test2" title="Second Pass"></series:facet>
</chart:display>
<hr />
<chart:display response="response" title="Files Indexed" subtitle="Per Day">
    <series:facet name="test1" type="column" title="First Pass"></series:facet>
    <series:facet name="test2" type="column" title="Second Pass"></series:facet>
</chart:display>
<hr />
<div>
    <h3 id="example_number-to-show-attribute">Number To Show Attribute</h3>
    <chart:display response="response" title="Population" type="line">
        <series:facet name="population" title="Current Population" number-to-show="5"></series:facet>
        <series:facet name="population2000" title="Population in 2000" number-to-show="5"></series:facet>
    </chart:display>
</div>
<div>
    <h3 id="example_show-marker-attribute">Show Marker Attribute</h3>
    <chart:display response="response" title="Population" type="line">
        <series:facet name="population" title="Current Population" show-marker="false"></series:facet>
        <series:facet name="population2000" title="Population in 2000" show-marker="false"></series:facet>
    </chart:display>
</div>
<div id="colour-demo">
    <h3 id="example_colour">
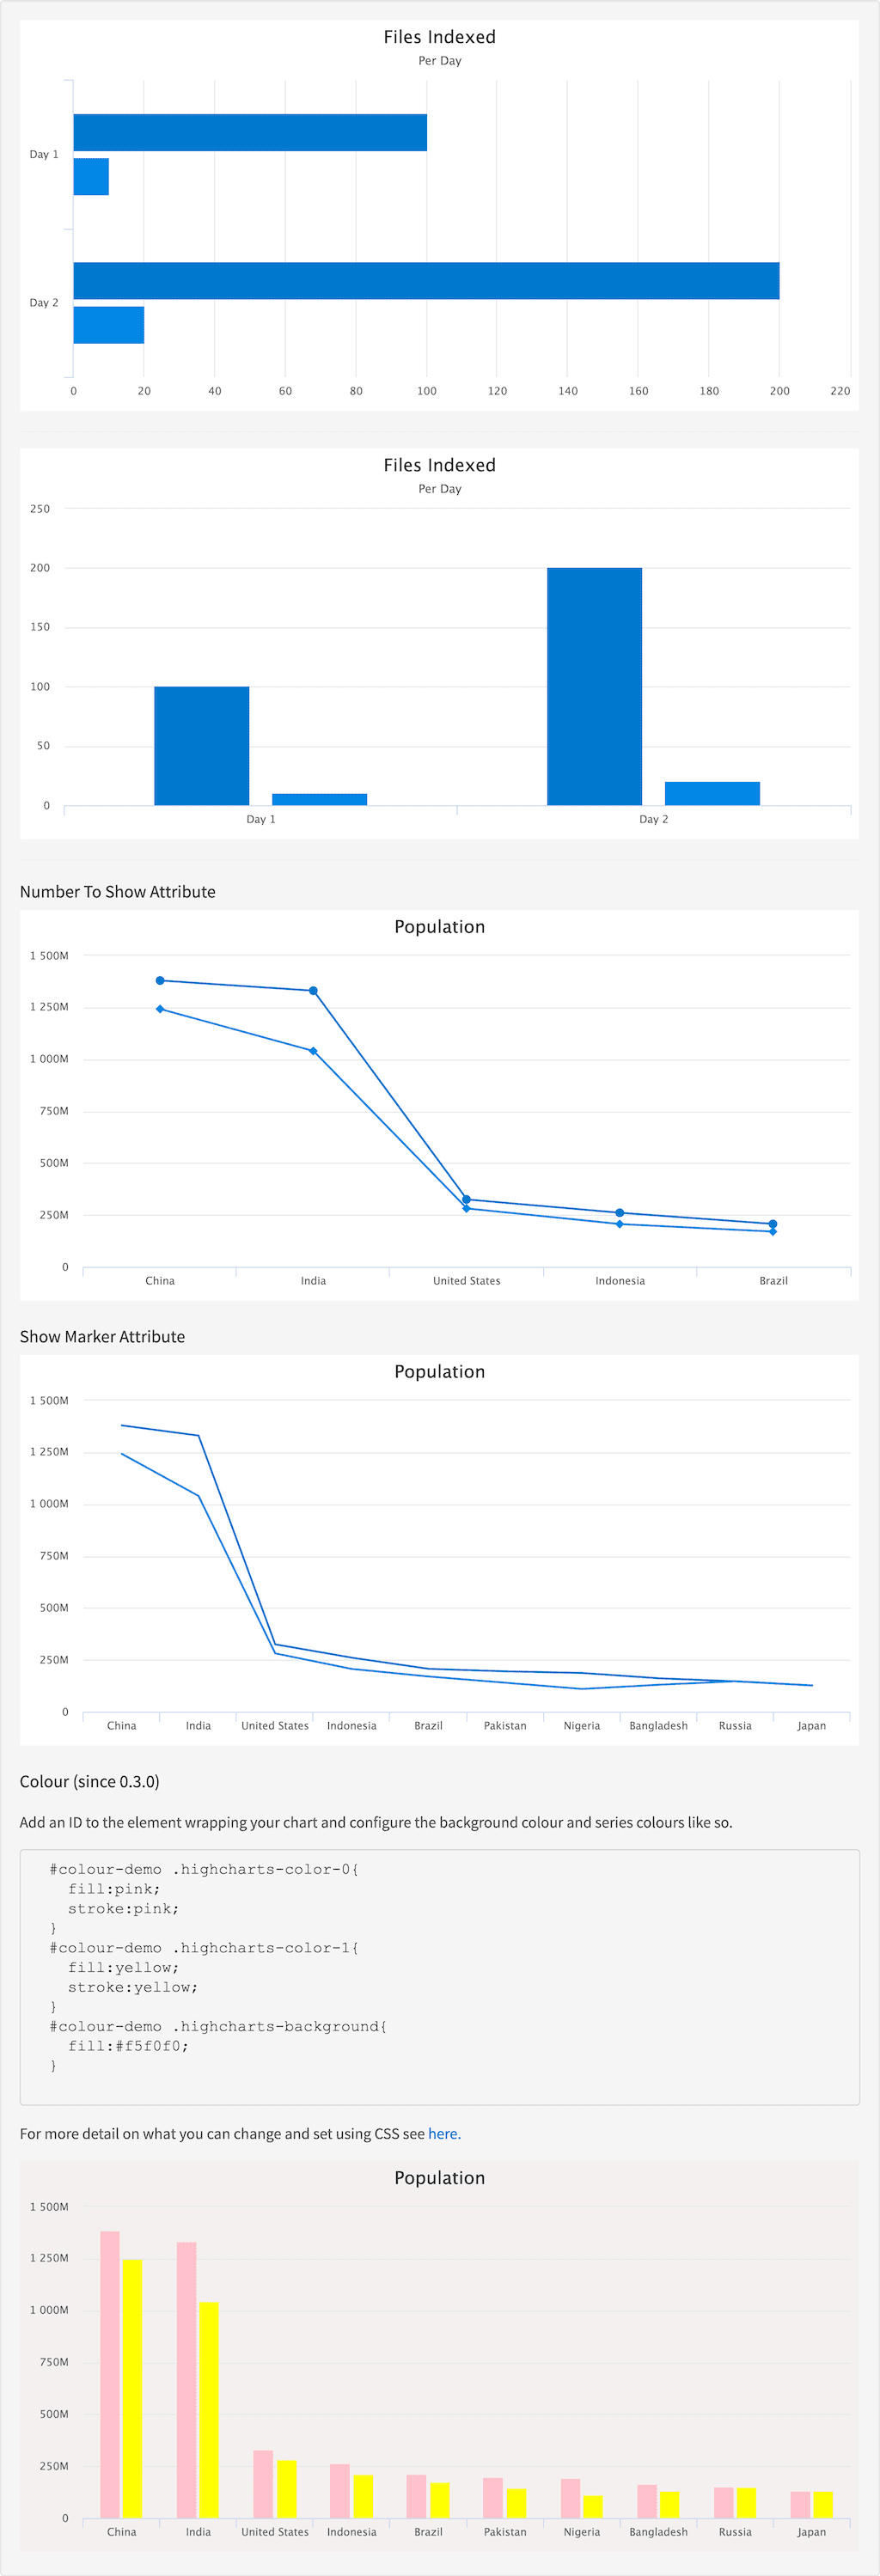
Colour (since 0.3.0)</h3>
    <p>Add an ID to the element wrapping your chart and configure the background colour and series colours like so.</p>
    <pre>
    #colour-demo .highcharts-color-0{
    fill:pink;
    stroke:pink;
    }
    #colour-demo .highcharts-color-1{
    fill:yellow;
    stroke:yellow;
    }
    #colour-demo .highcharts-background{
    fill:#f5f0f0;
    }
    </pre>
    <p>For more detail on what you can change and set using CSS see <a href="http://www.highcharts.com/docs/chart-design-and-style/style-by-css" target="_blank">here.</a></p>
    <chart:display response="response" title="Population" type="column">
        <series:facet name="population" title="Current Population"></series:facet>
        <series:facet name="population2000" title="Population in 2000"></series:facet>
    </chart:display>
```

```css wrap  theme={"dark"}
#colour-demo .highcharts-color-0 {
    fill: pink;
    stroke: pink;

    colour-demo .highcharts-color-1 {
        fill: yellow;
        stroke: yellow;

        colour-demo .highcharts-background {
            fill: #f5f0f0;
```

```js wrap  expandable  theme={"dark"}
angular.module('lightning')
.controller('ExampleController', ['$scope','$timeout','ResponseService', function($scope,$timeout, ResponseService) {
            $scope.response = {
                page: 2,
                query: {
                    rpp: 50
                },
                facets: {
                    test1: {
                        filters: [
                            {

                                val: {
                                    dsp: 'Day 1',
                                    act: 'Day 1',

                                },
                                count: 100,

                            },
                            {

                                val: {
                                    dsp: 'Day 2',
                                    act: 'Day 2',
                                },
                                count: 200,
                            }

                        ]
                    },
                    test2: {
                        filters: [
                            {

                                val: {
                                    dsp: 'Day 1',
                                    act: 'Day 1',
                                },
                                count: 10,

                            },
                            {

                                val: {
                                    dsp: 'Day 2',
                                    act: 'Day 2',
                                },
                                count: 20,
                            }

                        ]
                    },
                    population:{
                        filters: [
                            {
                                val: 'China',
                                count: 1379790000,
                            },
                            {
                                val: 'India',
                                count: 1330780000,
                            },
                            {
                                val: 'United States',
                                count: 324897000,
                            },
                            {
                                val: 'Indonesia',
                                count: 260581000,
                            },
                            {
                                val: 'Brazil',
                                count: 206927000,
                            },
                            {
                                val: 'Pakistan',
                                count: 194772000,
                            },
                            {
                                val: 'Nigeria',
                                count: 186987000,
                            },
                            {
                                val: 'Bangladesh',
                                count: 161401000,
                            },
                            {
                                val: 'Russia',
                                count: 146727405,
                            },
                            {
                                val: 'Japan',
                                count: 126693000,
                            },
                        ]
                    },
                    population2000:{
                        filters: [
                            {
                                val: 'China',
                                count: 1242612300,
                            },
                            {
                                val: 'India',
                                count: 1040000000,
                            },
                            {
                                val: 'United States',
                                count: 281421923,
                            },
                            {
                                val: 'Indonesia',
                                count: 206264595,
                            },
                            {
                                val: 'Brazil',
                                count: 170000000,
                            },
                            {
                                val: 'Pakistan',
                                count: 140000000,
                            },
                            {
                                val: 'Nigeria',
                                count: 110000000,
                            },
                            {
                                val: 'Bangladesh',
                                count: 130000000,
                            },
                            {
                                val: 'Russia',
                                count: 147000000,
                            },
                            {
                                val: 'Japan',
                                count: 127000000,
                            },
                        ]
                    },
                },
                results: []
            }

            ResponseService.setResponse('response', $scope.response);
        }]);
```

#### Result

<img src="https://mintcdn.com/lucidworks/ENcE8K39c0iEpL8J/assets/images/app-studio/as-examples/tags/seriesFacet.png?fit=max&auto=format&n=ENcE8K39c0iEpL8J&q=85&s=38e8046e42125e89f2c2a499296091af" alt="Result" width="1024" height="2998" data-path="assets/images/app-studio/as-examples/tags/seriesFacet.png" />
