> ## Documentation Index
> Fetch the complete documentation index at: https://doc.lucidworks.com/llms.txt
> Use this file to discover all available pages before exploring further.

# chart:gauge

export const LwTemplate = ({title = "Key questions to get you started", icon = "sparkles", cta = "Powered by Agent Studio", linkHref = "https://lucidworks.com/demo/?utm_source=docs&utm_medium=referral&utm_campaign=docs_cta_ai"}) => {
  const [isLoaded, setIsLoaded] = useState(false);
  useEffect(() => {
    const timer = setTimeout(() => {
      setIsLoaded(true);
    }, 500);
    return () => clearTimeout(timer);
  }, []);
  return <div className="lw-template-container">
      <Card title={title} icon={icon}>
        {isLoaded && <span dangerouslySetInnerHTML={{
    __html: `<lw-template id="a029c1a9-28be-427e-b0e1-5d918920246a"></lw-template
            >`
  }} />}
        <Link href={linkHref} className="agent-studio-link text-left text-gray-600 gap-2 dark:text-gray-400 text-sm font-medium flex flex-row items-center hover:text-primary dark:hover:text-primary-light group-hover:text-primary group-hover:dark:text-primary-light">Powered by Lucidworks Agent Studio</Link>
      </Card>
    </div>;
};

[localhost link]: http://localhost:3000/docs/4/app-studio/reference/tags/lightning.directive.chartGauge

[mintlify link]: https://doc.lucidworks.com/docs/4/app-studio/reference/tags/lightning.directive.chartGauge

[old doc.lw link]: https://doc.lucidworks.com/app-studio/4.2/1168

<LwTemplate />

## Description

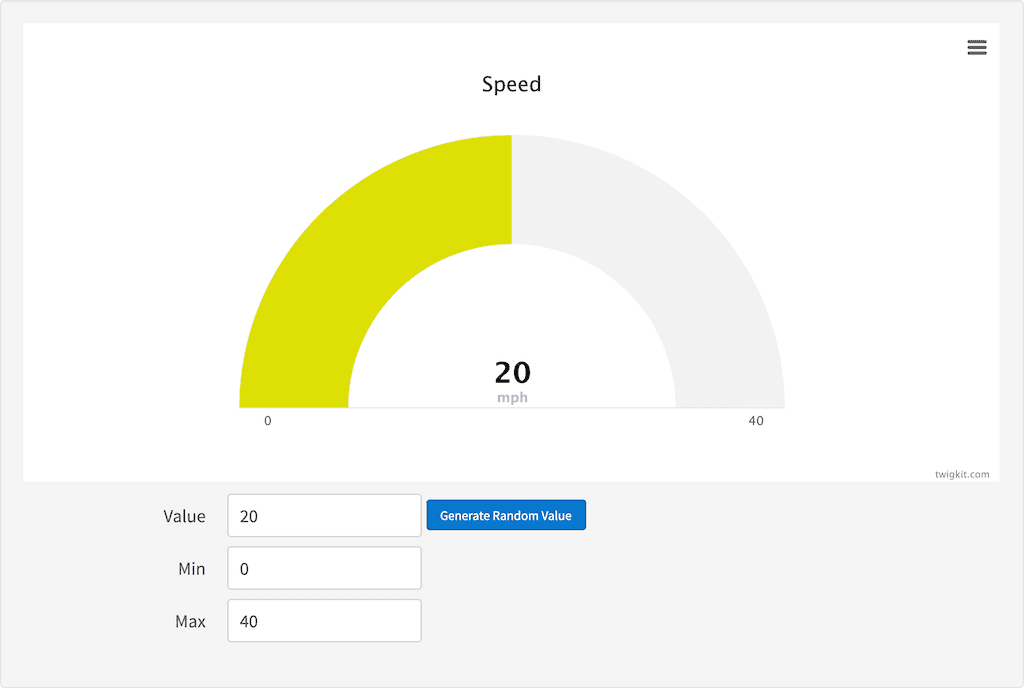
The chart gauge directive generates a gauge, you can also use the chart
export and chart credit directives to add this functionality to your
gauge.

## Usage

as element:

```xml wrap  theme={"dark"}
<chart:gauge
       value="{number}"
       min="{number}"
       max="{number}"
       [stops="{array}"]
       [title="{string}"]
       [value-suffix="{string}"]
       [height="{string}"]
       [options="{object}"]>
</chart:gauge>
```

### Directive info

* This directive creates new scope.

#### Parameters

| Param                      | Type       | Details                                                                                                                                                 |
| -------------------------- | ---------- | ------------------------------------------------------------------------------------------------------------------------------------------------------- |
| value                      | **number** | Value to be displayed on the gauge.                                                                                                                     |
| min                        | **number** | The smallest number that can be displayed on the gauge.                                                                                                 |
| max                        | **number** | The highest number that can be displayed on the gauge.                                                                                                  |
| stops  *(optional)*        | **array**  | The colours to render at each stop measured from 0 to 1. Default \[ \[0.1, '#DF5353'], // red \[0.5, '#DDDF0D'], // yellow \[0.9, '#55BF3B'] // green ] |
| title  *(optional)*        | **string** | The title of the chart.                                                                                                                                 |
| value-suffix  *(optional)* | **string** | Suffix for the value on the gauge.                                                                                                                      |
| height  *(optional)*       | **string** | Chart height. Default:400 (400px but px is not required!)                                                                                               |
| options  *(optional)*      | **object** | Extend the current options. Options can be found [here.](http://api.highcharts.com/highcharts/)                                                         |

## Example

#### Source

```xml wrap  expandable  theme={"dark"}
<div ng-controller="ExampleController">
    <chart:gauge value="{{value}}" min="{{min}}" max="{{max}}" title="Speed" value-suffix="mph" stops="[[0.1, '#55BF3B'], [0.5, '#DDDF0D'], [0.9, '#DF5353']]">
        <chart:credit text="twigkit.com" href="http://www.twigkit.com"></chart:credit>
        <chart:export file-name="gauge"></chart:export>
    </chart:gauge>
    <form class="tk-stl-form tk-stl-form-aligned">
        <fieldset>
            <div class="tk-stl-control-group">
                <label for="value">Value</label>
                <input id="value" type="number" placeholder="Value" ng-model="value">
                <button ng-click="generateNewNumber()" style="button tiny">Generate Random Value</button>
            </div>

            <div class="tk-stl-control-group">
                <label for="min">Min</label>
                <input id="min" type="number" placeholder="Min" ng-model="min">
            </div>
            <div class="tk-stl-control-group">
                <label for="max">Max</label>
                <input id="max" type="number" placeholder="Max" ng-model="max">
            </div>

        </fieldset>
    </form>
</div>
```

```js wrap  theme={"dark"}
angular.module('lightning')
.controller('ExampleController', ['$scope','$timeout', function($scope,$timeout) {
            $scope.value = 20;
            $scope.min = 0;
            $scope.max = 40

            $scope.generateNewNumber = function(){
            $scope.value = Math.floor(Math.random() * ($scope.max - $scope.min + 1)) + $scope.min;
            };
        }]);
```

#### Result

<img src="https://mintcdn.com/lucidworks/_JCWsGwGCZxJia7w/assets/images/app-studio/as-examples/tags/chartGauge.png?fit=max&auto=format&n=_JCWsGwGCZxJia7w&q=85&s=68d8d1aef03a48273ffb1db44c538f67" alt="Result" width="1024" height="688" data-path="assets/images/app-studio/as-examples/tags/chartGauge.png" />
